Wednesday
Wednesday: Data Lab, the Stride Timing
"Lab day," Comet says, setting cones along the park loop at 5, 10, 15, 20, 25, 30 strides.
"Walk from the start to each cone," Wren says. "I time it. One pair of numbers per cone."
Comet walks to the first cone. "4 seconds," Wren calls. She walks to the second. "8."
Six cones, six times. Nova plots them as Wren reads. "30 strides, 22 seconds. Would you like a hint? Look at the shape."
"Almost a perfect line," Comet says. "Steady walking makes a steady slope. What do you notice, Wren?"
"The slope is about 0.7 seconds per stride," he says. "And the intercept is near zero, which makes sense."
"Zero strides, zero seconds," Comet says. "The intercept has a meaning here. It did not on the practice chart."
What you need
- A stopwatch or kitchen timer, a tape measure or six markers (cones, sticky notes or chalk marks).
- Graph paper, a pencil and your Run Log.
- A partner to hold the stopwatch, and a grown-up who knows where you are.
Water is at hand. Stop and rest if you feel out of breath.
Cut any paper markers with scissors on paper. Nothing heavy is lifted alone.
Run the lab
- Mark six spots along a safe path at 5, 10, 15, 20, 25, 30 of your own strides from the start.
- Walk at a steady pace from the start to the first mark. Your partner times it in whole seconds.
- Return to the start and walk to the second mark. Time it. Repeat for every mark.
- Write the six pairs (strides, seconds) in a table in your Run Log.
- Plot the six dots on graph paper, strides across and seconds up. Say direction, form, strength, strays.
- Lay a pencil through the dots by eye. Then use a calculator to find the least-squares slope and intercept.
The crew's lab table
Here are the crew's own six timings from Nova's Run Log. Yours will differ, and that is the point.
| Cone | Strides | Seconds |
|---|---|---|
| 1 | 5 | 4 |
| 2 | 10 | 8 |
| 3 | 15 | 11 |
| 4 | 20 | 15 |
| 5 | 25 | 19 |
| 6 | 30 | 22 |
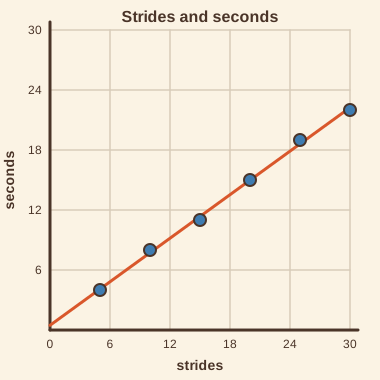
The crew's line is seconds = 0.73 × strides + 0.47. The slope says each stride takes about 0.7 seconds.
The intercept 0.47 is close to zero. At zero strides, no time has passed, so a small intercept makes sense.
- Read the question.
- Tap your answer.
The crew's points are (5, 4), (10, 8), (15, 11), (20, 15), (25, 19), (30, 22). What is the slope of the least-squares line? (Round to 2 places.)| Statement | True or false? |
|---|---|
| Steady walking gives a scatter plot with a nearly straight line. | ? |
| In the stride timing, the intercept should be far from zero. | ? |
| 22 - 4 = 18 | ? |
| Your lab line should match the crew's exactly. | ? |
Good lab work. Tomorrow you see why squares are the right gaps to add, and a residual plot judges the fit.