Thursday
Thursday: Residuals Judge the Fit
"Why squares?" Comet asks. "Why not just add the gaps?"
"Add the plain gaps and the positives cancel the negatives," Wren says. "A terrible line could score zero."
"Squares are all positive," Comet says. "And a big gap counts a lot more than two small ones."
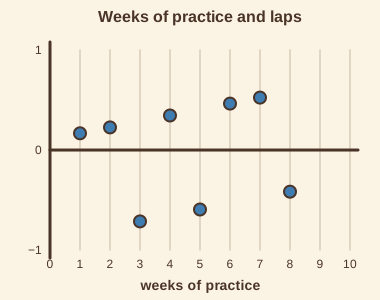
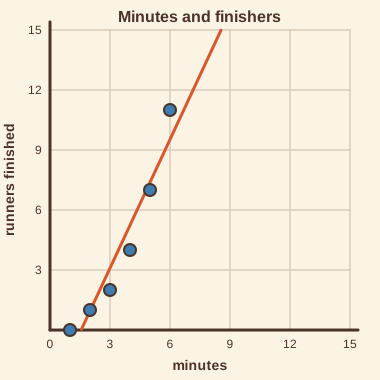
Nova projects a second chart: minutes into the practice run against runners who had finished. "Would you like a hint? Fit a line, then look at the residuals."
Wren fits one. "Slope 2.1. But look. The first dots sit above the line, the middle ones below, the last one far above."
"A U-shape in the residuals," Comet says. "The line is missing a curve. What do you notice about the practice chart?"
"Its residuals scatter with no pattern," Wren says. "That line fits. This one does not."
How the least-squares line is chosen
Read the five steps, then put them in order below.
- Pick any line. For each dot, find its residual: observed y minus the line's y.
- Adding the plain residuals is no good. Positives above the line cancel negatives below it.
- Square each residual. Every square is positive, and a large gap counts far more than a small one.
- Add the squares. That sum measures how badly the line misses the dots.
- Choose the line with the smallest sum. That one line is the least-squares line.
- ?Square each residual so every gap counts and big gaps count more
- ?Notice that plain residuals cancel, above against below
- ?Choose the line with the smallest score
- ?Add the squared residuals to score the line
- ?Pick a line and find every residual, observed minus predicted
A residual plot
A residual plot puts the explanatory variable across and each dot's residual up, with a zero line through the middle.
If the dots scatter above and below zero with no pattern, the line fits the data well.
If the dots make a curve, a U or an arch, the line is missing a pattern. A straight line is the wrong model.
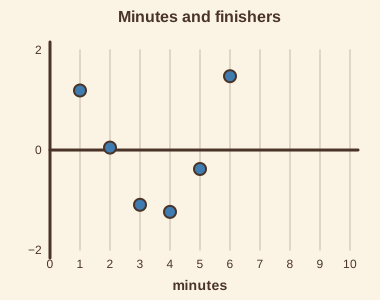
| Minutes | Finished observed | Finished predicted | Residual |
|---|---|---|---|
| 1 | 0 | -1.2 | 1.2 |
| 2 | 1 | 1 | 0 |
| 3 | 2 | 3.1 | -1.1 |
| 4 | 4 | 5.2 | -1.2 |
| 5 | 7 | 7.4 | -0.4 |
| 6 | 11 | 9.5 | 1.5 |
- Read the question.
- Tap your answer.
| Statement | True or false? |
|---|---|
| Adding plain residuals lets positives and negatives cancel. | ? |
| A residual plot with a clear U-shape means the line fits well. | ? |
| 9 - 3 = 6 | ? |
| A dot below the line has a negative residual. | ? |
Square the gaps and add them. Then try a slightly tilted line and see if the sum shrinks.
Careful reasoning. Tomorrow a falling line: warm-up minutes against lap times, and the week in review.