Tuesday
Tuesday: The Line That Fits Best
Comet holds a length of string across the wall chart. "Through the middle of the notes. Like this?"
"Close," Wren says. "Tilt it a little. Now the gaps above and below look even."
"But you and I would tilt it differently," Comet says. "What can we make that everyone agrees on?"
Nova projects the eight dots with eight tiny gaps drawn to a line. "Would you like a hint? Square each gap, then add."
"The least-squares line," Wren says. "The line whose squared gaps add to the least. Slope 0.94, intercept 1.89."
"So each extra week of practice goes with about 0.9 more laps," Comet says. "That is the slope, in our units."
"And 1.89 laps at zero weeks," Wren says. "The intercept. A starting level, roughly, before any practice."
"One line, no arguing," Comet says, and pins the string along it.
Way 1: a line by eye
Stretch a string through the cloud so the dots above and below balance. This gives a quick, rough line.
Two people get two slightly different lines. By eye is good for a first look, not for a shared answer.
Way 2: the least-squares line
For any line, each dot has a residual: observed y minus the y the line predicts. Above the line is positive, below is negative.
Square every residual and add them up. The least-squares line is the one line that makes that sum as small as possible.
For the crew's eight runners it is laps = 0.94 × weeks + 1.89. A calculator or spreadsheet finds it from the data.
The slope and the intercept are read in the data's units. Here the units are laps and weeks.
Slope and intercept in the crew's units
Slope 0.94: for each extra week of practice, the line predicts about 0.9 more laps. That is a rate of change.
Intercept 1.89: at 0 weeks of practice the line predicts about 1.89 laps. That is the constant term, a starting level.
A prediction inside the data's range is reasonable. Far outside it, the line may be wrong, so say so.
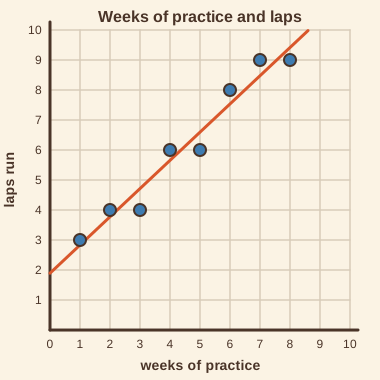
| Runner | Weeks | Laps observed | Laps predicted | Residual |
|---|---|---|---|---|
| Ash | 1 | 3 | 2.8 | 0.2 |
| Bo | 2 | 4 | 3.8 | 0.2 |
| Cy | 3 | 4 | 4.7 | -0.7 |
| Dee | 4 | 6 | 5.7 | 0.3 |
| Eli | 5 | 6 | 6.6 | -0.6 |
| Fay | 6 | 8 | 7.5 | 0.5 |
| Gus | 7 | 9 | 8.5 | 0.5 |
| Hal | 8 | 9 | 9.4 | -0.4 |
- Read the question.
- Tap your answer.
The crew's points are (1, 3), (2, 4), (3, 4), (4, 6), (5, 6), (6, 8), (7, 9), (8, 9). What is the slope of the least-squares line? (Round to 2 places.)The crew's points are (1, 3), (2, 4), (3, 4), (4, 6), (5, 6), (6, 8), (7, 9), (8, 9). What is the y-intercept of the least-squares line? (Round to 2 places.)- Read the question.
- Tap your answer.
| Statement | True or false? |
|---|---|
| The least-squares line makes the sum of the squared residuals as small as possible. | ? |
| Two people fitting a line by eye always get the same line. | ? |
| A slope of 0.94 means about 0.9 more laps for each extra week. | ? |
| The intercept is the change in y for one more unit of x. | ? |
Compare your by-eye intercept with the least-squares intercept 1.89. Write how far off you were.
Two ways, and the second one settles arguments. Tomorrow is Data Lab: strides, a stopwatch and your own line of fit.