Monday
Monday: A Cloud of Dots
A wall chart hangs in the center hallway, blank except for two labeled axes.
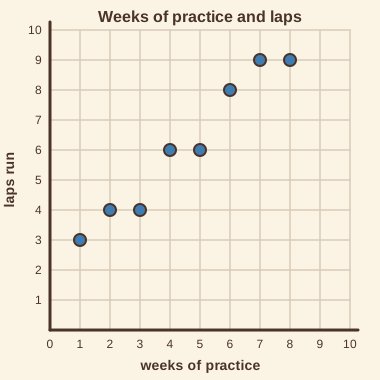
"Weeks of practice across, laps run up," Comet says. "One sticky note per runner. 8 runners in the log."
Wren reads from Nova's Run Log. "Ash, 1 week, 3 laps. Bo, 2 weeks, 4 laps." Comet presses each note into place.
The last note goes up. "Hal, 8 weeks, 9 laps." They step back.
"What do you notice?" Wren asks.
"The notes climb," Comet says. "More weeks, more laps, mostly. Not a perfect staircase, but a slope."
Nova hovers beside the chart and glows a faint diagonal band through the notes. "Would you like a hint? Two variables, one dot each."
"A scatter plot," Wren says. "Tomorrow we stretch a string through it and find the line."

Two variables, one dot each
A scatter plot shows two quantitative variables at the same time. Each runner is one dot.
The dot's position across is that runner's weeks of practice. Its position up is that runner's laps.
The variable across, on the x-axis, is the explanatory variable. The crew uses it to explain or predict the other.
The variable up, on the y-axis, is the response variable. It is the thing the crew wants to predict.
Every number here is the crew's own made-up reading from Nova's Run Log, not a fact about any real runner.
| Runner | Weeks of practice | Laps run |
|---|---|---|
| Ash | 1 | 3 |
| Bo | 2 | 4 |
| Cy | 3 | 4 |
| Dee | 4 | 6 |
| Eli | 5 | 6 |
| Fay | 6 | 8 |
| Gus | 7 | 9 |
| Hal | 8 | 9 |
A solved problem to study
Here is how Wren describes the crew's scatter plot in four short steps.
- Direction: as weeks of practice go up, laps go up too. The pattern is positive.
- Form: the dots lie close to a straight band, not a curve. The pattern is roughly linear.
- Strength: the dots stay near the band with small gaps. The pattern is fairly strong.
- Strays: no dot sits far from the band. Dee at 4 weeks and 6 laps is a little high, nothing more.
Direction, form, strength, strays. Say those four words every time you meet a new scatter plot.
- Read the question.
- Tap your answer.
| Statement | True or false? |
|---|---|
| Each dot on a scatter plot stands for one runner and two numbers. | ? |
| The explanatory variable goes on the y-axis. | ? |
| 9 - 3 = 6 | ? |
| A positive pattern means the dots climb from left to right. | ? |
Plot the eight dots. Then say the four words: direction, form, strength, strays.
A clear picture. Tomorrow Comet stretches a string through the dots, and Wren finds the line that fits best.