Friday
Friday: Lines That Fall
"New chart," Wren says. "Warm-up minutes across, lap time up. 7 runners from the log."
Comet plots the dots. "They go down. More warm-up, faster lap. What do you notice?"
"A negative slope," Wren says. "-0.38. Each extra warm-up minute goes with about 0.4 fewer minutes of lap time."
"And the intercept is 9.68," Comet says. "A lap time of about 9.68 minutes with no warm-up at all, by the line."
Nova projects both charts side by side, one rising and one falling. "Would you like a hint? The sign of the slope tells the direction."
"Positive climbs, negative falls," Comet says. "Same tools, opposite story."
"Our fun run poster can show both," Wren says. "Practice helps, warm-up helps, and a line says by how much."
Lines in the everyday world
Lines of fit show up anywhere two numbers move together: a steady walk, a growing plant, a draining tank.
The slope's sign tells the direction. Positive means y rises with x. Negative means y falls as x rises.
The slope's size tells the rate, in the data's units. The intercept tells the starting level at x = 0.
Always ask whether the intercept means anything. Zero strides, zero seconds makes sense. Zero weeks of practice is a stretch.
| Runner | Warm-up minutes | Lap time in minutes |
|---|---|---|
| Ash | 2 | 9 |
| Bo | 4 | 8 |
| Cy | 5 | 8 |
| Dee | 6 | 7 |
| Eli | 8 | 7 |
| Fay | 10 | 6 |
| Gus | 12 | 5 |
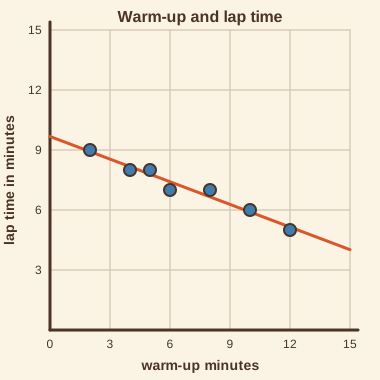
The crew's falling line is lap time = -0.38 × warm-up minutes + 9.68. Every number is the crew's own Run Log reading.
- Read the question.
- Tap your answer.
The crew's points are (2, 9), (4, 8), (5, 8), (6, 7), (8, 7), (10, 6), (12, 5). What is the slope of the least-squares line? (Round to 2 places.)- Read the question.
- Tap your answer.
| Statement | True or false? |
|---|---|
| A negative slope means y falls as x rises. | ? |
| The intercept always has a real-world meaning. | ? |
| 9 - 5 = 4 | ? |
| A line of fit describes a tendency in the data, not a rule for every case. | ? |
Collect five pairs and plot them. Does the line rise or fall? What does its slope mean?
A full week of lines. Tomorrow is Track Day: a family scatter plot and a line of fit from your own home.