Thursday
Thursday: How Strong Is the Pattern?
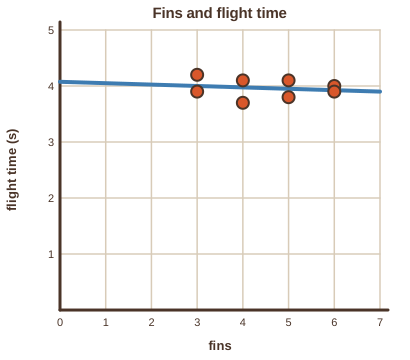
Wren pins three scatter plots side by side. "Pumps and height. Ramp and time. Fins and flight time."
"The first two are tight," Comet says. "The fins one is a blob. Four fins, five fins, it barely matters."
"We need a number for tight," Wren says. "Nova?"
Nova projects three values under the plots. "r is 0.98, -0.98 and close to 0. Would you like a hint about the signs?"
"Positive when the dots rise, negative when they fall," Comet says. "And near zero when there is no line to follow."
"The correlation coefficient," Wren says. "Always between -1 and 1. The closer to the ends, the tighter the dots."
"So fins did not change our flights," Comet says. "Good. Fewer fins to cut on Fair Day."
The correlation coefficient
The correlation coefficient r measures how tightly dots follow a straight line and which way. A graphing tool computes it.
r is always between -1 and 1. Near 1 means a strong positive pattern, near -1 a strong negative pattern, near 0 almost none.
r has the same sign as the slope of the least-squares line. Its size says how close the dots sit to that line.
| Size of r | Read it as |
|---|---|
| 0.7 to 1, or -0.7 to -1 | strong |
| 0.3 to 0.7, or -0.3 to -0.7 | moderate |
| -0.3 to 0.3 | weak or none |
The crew's three plots
All three data sets are the crew's own made-up Loft trials. The fins trials vary the cardboard fins from 3 to 6 at the same pump count.
| Trial | 1 | 2 | 3 | 4 | 5 | 6 | 7 | 8 |
|---|---|---|---|---|---|---|---|---|
| Fins | 3 | 4 | 5 | 6 | 3 | 4 | 5 | 6 |
| Flight time (s) | 3.9 | 4.1 | 3.8 | 4 | 4.2 | 3.7 | 4.1 | 3.9 |
| Data set | Slope | r | Read it as |
|---|---|---|---|
| pumps and height | 1.25 | 0.98 | strong and positive |
| ramp height and run time | -0.05 | -0.98 | strong and negative |
| fins and flight time | -0.03 | -0.18 | weak and negative |
r says how tight, not why. A strong r between pumps and height does not by itself prove pumps cause height. The crew knows that from the build, not from r.
- Read the question.
- Tap your answer.
| Statement | True or false? |
|---|---|
| r is always between -1 and 1. | ? |
| An r of -0.98 means a weak relationship. | ? |
| r has the same sign as the slope of the least-squares line. | ? |
| A strong r proves that one measurement causes the other. | ? |
| The fins data have an r near zero, so fins barely changed the flight time. | ? |
Then make up eight with a strong negative relationship. Which plot was harder to invent?
Sharp reading. Tomorrow you meet data that bend, where a parabola or an exponential beats any line.