Friday
Friday: When a Line Is Wrong
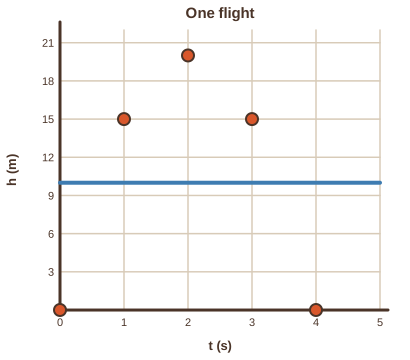
Comet plots one flight: height every second from launch to landing. "0, 15, 20, 15, 0. Line of best fit, Nova?"
Nova projects a flat line across the middle. "The least-squares line. Would you like a hint about the residuals?"
"Below, above, above, above, below," Wren says. "The residuals make a pattern. The line is wrong here."
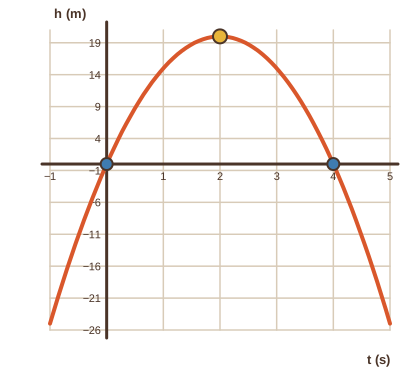
"Of course it is," Comet says. "That is our parabola from last week. No line fits a hill."
Wren pins up the folded strip data. "Folds against layers: 2, 4, 8, 16, 32. What do you notice?"
"Doubling. Exponential," Comet says. "A line would miss low and high and hit the middle."
"So before you fit a line, look at the shape," Wren says. "The dots tell you which model to try."
Residuals with a pattern
If a line fits, the residuals look random: some above, some below, no pattern. If they curve, the model is wrong.
For the one-flight data, the least-squares line is flat: slope 0, height 10 all the way across. Its residuals run below, above, above, above, below.
That pattern says the data bend. The parabola h = -5t² + 20t from week 11 passes through every dot exactly.
Three shapes to know
| Shape of the dots | Model to try | Check | Loft example |
|---|---|---|---|
| straight band | linear, y = mx + b | equal differences in a table | pumps and height |
| an arch or a U | quadratic, y = ax² + bx + c | differences change by a constant | height during one flight |
| a curve that climbs faster and faster | exponential, y = a × rˣ | equal ratios in a table | folds and layers |
| Folds | 1 | 2 | 3 | 4 | 5 |
|---|---|---|---|---|---|
| Layers | 2 | 4 | 8 | 16 | 32 |
| Line predicts | -2 | 5.2 | 12.4 | 19.6 | 26.8 |
The folds line y = 7.2x - 9.2 has a high r of 0.93. Yet it predicts -2 layers for one fold and misses at both ends.
A high r does not mean the right model. The shape of the dots does.
- Read the question.
- Tap your answer.
- Read the question.
- Tap your answer.
| Statement | True or false? |
|---|---|
| Residuals with no pattern mean the line fits well. | ? |
| A high r always means a line is the right model. | ? |
| Equal ratios in a table point to an exponential model. | ? |
| Height during one flight is best modeled by a line. | ? |
| Look at the shape of the dots before choosing a model. | ? |
Try to lay a straight line through the dots. Where does it miss?
Terrific week, and a terrific course. Tomorrow is Fair Day, and the family is your crowd.