Wednesday
Wednesday: Loft Lab, Ramp Height and Run Time
Comet props the plank on a stack of books. "Lab day. Ramp height against run time. Six heights, three runs each."
Wren sets the cart at the top tape mark. "Ten centimeters first. Go." The stopwatch clicks at the bottom mark.
"2.4 seconds," he says. "Now 15 centimeters. What do you notice as the ramp gets steeper?"
"Faster. Shorter time." Comet lifts the plank again. "The dots will go down to the right this time."
Nova projects the growing scatter plot. "Would you like a hint? A line can slope down and still fit well."
"Negative slope, negative relationship," Wren says. "Higher ramp, less time."
"And the fair crowd will love timing it," Comet says. "This is our first Fair Day table."
What you need
- The long plank, two sawhorses or a stack of books, the small wooden cart and tape marks 1 meter apart.
- A tape measure, a stopwatch, graph paper and your Loft Log.
Make sure the cart has a clear, soft landing zone at the bottom. Nothing fragile nearby.
Stand to the side of the ramp, never at the bottom end. Keep shoes on in the garage.
Run the lab
- Set the top of the ramp at 10 cm. Measure from the floor to the top of the plank.
- Release the cart from the top tape mark without pushing. Time it to the bottom mark.
- Run it three times and take the middle time. Record ramp height and run time.
- Lift the ramp another 5 cm and repeat, up to 35 cm.
- Plot ramp height across and run time up. Draw a line of best fit by eye.
- Say what the slope means in a sentence with units.
The crew's Loft runs
The crew's run times are their own middle values, made up for the Loft. Your plank and cart will give your own.
| Ramp height (cm) | 10 | 15 | 20 | 25 | 30 | 35 |
|---|---|---|---|---|---|---|
| Run time (s) | 2.3 | 2.2 | 2 | 1.5 | 1.3 | 1.2 |
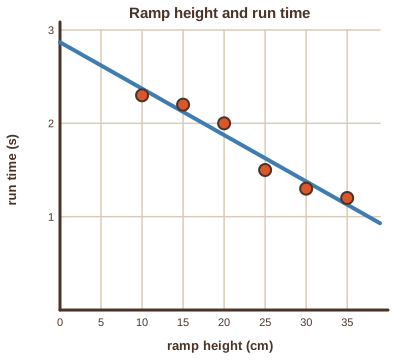
Nova's line is y = -0.05x + 2.87. The slope -0.05 means about 0.5 seconds less for every 10 cm of extra height.
The dots bend a little: the drop in time is bigger at low ramps than at high ones. Hold that thought for Friday.
- Read the question.
- Tap your answer.
| Statement | True or false? |
|---|---|
| A negative slope means the two measurements move in opposite directions. | ? |
| A line that slopes down cannot be a good fit. | ? |
| The intercept 2.87 is the run time the line predicts for a flat ramp. | ? |
| The crew pushed the cart harder on the high ramps. | ? |
| Far beyond the data, the line might predict a run time below zero. | ? |
Great lab work. Tomorrow the crew puts a number on how tight a pattern is: the correlation coefficient.