Loft Day
Fair Day: The Loft Opens
The garage door rolls up. The ramp is set on its sawhorses, the launcher waits in the backyard and the data poster hangs on the wall.
"Three tables," Comet says. "Ramp timing, the tiles puzzle and the launch chart. Everyone gets a turn."
A visitor rolls the cart and reads the stopwatch. Wren adds the dot to the ramp plot. "What do you notice?"
"It landed right on your line," the visitor says. "Nearly," Wren says. "The residual is small."
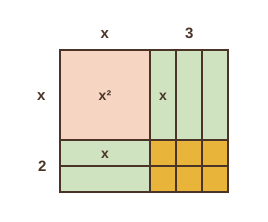
At the tiles table, someone slides an x² square, five x strips and six unit squares into a rectangle. "x plus 2 by x plus 3!"
Nova projects the launch chart. "Would you like to predict the next flight before we launch?"
"Ten pumps," says Comet. "About 12.7 meters, by the line." The grown-up gives the go, and everyone stands back.
- A scatter plot shows two measurements per trial. Read its direction, tightness and shape.
- The least-squares line makes the squared residuals as small as possible. Say its slope and intercept with units.
- r, between -1 and 1, measures how tight and which way. It does not prove cause.
- Patterned residuals mean the wrong model. An arch calls for a quadratic, equal ratios for an exponential.
- From week 1 to week 12: units, equations, functions, lines, systems, exponents, polynomials, factoring, quadratics and data.
Tiles puzzle: cut one big square, five strips and six small squares from colored cardboard. Challenge everyone to slide them into one rectangle and name its sides.
Launch chart: show the pumps and height plot with its line. Have everyone predict the height for a new pump count before the launch, then compare.
Close with the poster. Each person says one thing the data showed and one thing they would measure next.
A grown-up helps lift the plank, and the cart gets a soft landing zone with nothing fragile nearby.
A prediction that misses is the best moment of the day: ask what the residual is and what might explain it.
Every number on the poster is the family's own, measured today or made up for practice. None of it is a fact about the world.
- Read the question.
- Tap your answer.