Wednesday
Wednesday: Data Lab, Twenty Pennant Draws
"Draw a token, read it, put it back, shake," Comet says. "Twenty times. Wren keeps the tally."
She draws. "One." Again. "One." Again. "Three." The tally fills three rows.
After twenty draws Wren reads it. "One pennant 11 times, two pennants 5 times, three pennants 4 times."
"What do you notice?" he asks. "The bag says 1/2, 3/10, 1/5. The tally says 11/20, 1/4, 1/5."
Nova projects two sets of bars side by side. "Would you like a hint? Find the mean of the tally."
"1.65 pennants," Comet says. "The bag's expected value is 1.7. Close, not equal."
"Twenty draws wobble," Wren says. "An empirical distribution from a small tally drifts toward the theoretical one as the draws pile up."
What you need
- A cloth bag or a cup and 10 tokens or paper scraps: 5 marked 1, 3 marked 2, 2 marked 3.
- Your Run Log and a pencil.
- A partner to keep the tally, and a grown-up aware of where you are.
Cut paper scraps with scissors on paper or cardboard, never toward a hand.
Any jogging this week, and Race Day itself, happens on the park loop with a grown-up aware and water at hand. No one runs on a road.
Nothing heavy is lifted alone.
Run the lab
- Put 10 tokens in the bag: 5 marked 1, 3 marked 2, 2 marked 3. Shake it.
- Draw one token, write its number, put it back and shake again.
- Repeat until you have 20 draws. Tally how many showed 1, 2 and 3.
- Turn each tally into a fraction of 20. That is your empirical distribution.
- Write the bag's theoretical distribution beside it: 1/2, 3/10, 1/5. Compare bar by bar.
- Find the mean of your 20 numbers and compare it with the bag's expected value 1.7.
The crew's lab log
Here is the crew's own tally from twenty draws. Yours will differ, and that is the point of a lab.
| Pennants | Tally (of 20) | Empirical probability | Theoretical probability |
|---|---|---|---|
| 1 | 11 | 11/20 | 1/2 |
| 2 | 5 | 1/4 | 3/10 |
| 3 | 4 | 1/5 | 1/5 |
The crew's empirical expected value is 1 × 11/20 + 2 × 1/4 + 3 × 1/5 = 1.65. The bag's is 1.7.
Both are means of a distribution. One comes from twenty draws, the other from the ten tokens themselves.
- Read the question.
- Tap your answer.
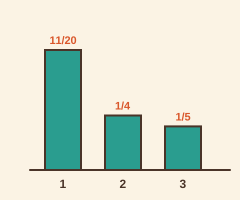 The crew's tally gives 1 pennant with probability 11/20, 2 with probability 1/4, 3 with probability 1/5. What is the empirical expected value?
| What the lab shows | True or false? |
|---|---|
| 11 + 5 + 4 = 20 | ? |
| The empirical distribution comes from the tally; the theoretical one comes from the tokens in the bag. | ? |
| A tally of twenty draws must match the bag's distribution exactly. | ? |
| 1 × 11/20 + 2 × 1/4 + 3 × 1/5 = 1.65 | ? |
Careful lab work. Tomorrow expected value weighs two decisions, and a two-way table judges the worn-tire check.