Tuesday
Tuesday: Theoretical and Empirical Distributions
"The start-table game," Comet says. "Flip two coins. The runner with the most heads leads the warm-up lap."
"Four equally likely outcomes," Wren says, writing HH, HT, TH, TT. "X is the number of heads."
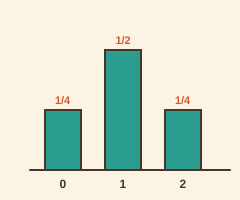
"Zero heads once, one head twice, two heads once," Comet counts. "1/4, 1/2, 1/4. Expected value 1."
"That one came from the sample space," Wren says. "Now the practice laps. No sample space tells us how many laps a runner does."
Nova projects Tuesday's tally. "Would you like a hint? Use the counts as the probabilities."
"6 ran one lap, 10 ran two, 4 ran three, out of 20," Comet reads. "3/10, 1/2, 1/5."
"Expected value 1.9 laps," Wren says. "What do you notice? Same method, different source."
"Theoretical from counting outcomes, empirical from a tally," Comet says. "Both make a distribution."
Way one: a theoretical distribution from a sample space
Two coin flips have 4 equally likely outcomes: HH, HT, TH, TT. X counts the heads.
Group the outcomes by value. X = 0: TT. X = 1: HT and TH. X = 2: HH.
Each probability is a group count over 4: 1/4, 1/2, 1/4. These are theoretical probabilities.
Expected value: 0 × 1/4 + 1 × 1/2 + 2 × 1/4 = 1 head.
Way two: an empirical distribution from a tally
Laps per runner at Tuesday practice have no sample space to count. The crew uses Nova's tally of 20 runners instead.
P(1 lap) = 6/20 = 3/10, P(2 laps) = 1/2, P(3 laps) = 1/5. These are empirical probabilities.
Expected value: 1 × 3/10 + 2 × 1/2 + 3 × 1/5 = 1.9 laps per runner.
For 30 runners on Race Day, the crew expects about 1.9 × 30 = 57 laps, so about 57 water cups.
| Laps per runner | Tally | Empirical probability | Value × probability |
|---|---|---|---|
| 1 | 6 | 3/10 | 3/10 |
| 2 | 10 | 1/2 | 1 |
| 3 | 4 | 1/5 | 3/5 |
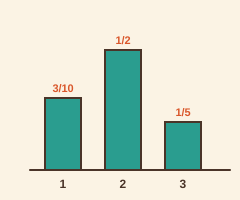
Same method both ways: list the values, attach probabilities, check they add to 1, then multiply and add. Only the source of the probabilities differs.
- Read the question.
- Tap your answer.
Two flips give 0 heads with probability 1/4, 1 head with probability 1/2, 2 heads with probability 1/4. What is the expected number of heads?A runner does 1 lap with probability 3/10, 2 laps with probability 1/2, 3 laps with probability 1/5. What is the expected value, in laps?- Read the question.
- Tap your answer.
| Statement | True or false? |
|---|---|
| 1/4 + 1/2 + 1/4 = 1 | ? |
| A theoretical probability is counted from equally likely outcomes. | ? |
| An empirical probability needs a tally of what actually happened. | ? |
| 1 × 3/10 + 2 × 1/2 + 3 × 1/5 = 1.9 | ? |
| Expected value works only for theoretical distributions. | ? |
Compare it with the theoretical 1/4, 1/2, 1/4. Find the mean of your twenty counts.
Two sources, one method. Tomorrow is Data Lab: twenty draws from the pennant bag against the bag's own distribution.