Monday
Monday: A Random Variable and Its Distribution
"Every finisher draws one token from the pennant bag," Comet says. "5 marked 1, 3 marked 2, 2 marked 3."
"So the number of pennants is a random variable," Wren says. "A number for each token. Call it X."
"P(X = 1) is 1/2, P(X = 2) is 3/10, P(X = 3) is 1/5," Comet reads. "They add to 1."
Nova projects three bars. "Would you like a hint? Graph it like a data set, values across and probabilities up."
"What do you notice?" Wren asks. "The bars lean left. Most finishers take one pennant."
"Then how many pennants should we make for 40 finishers?" Comet asks. "We cannot make exactly the right number."
"We can find the mean," Wren says. "Each value times its probability, added. 1.7 pennants per finisher, in the long run."
"Race Day is Saturday," Comet says. "Let us build the whole awards table on that."

A random variable
A random variable gives each outcome a number. Here X is the pennants on the drawn token: 1, 2 or 3.
Its probability distribution lists each value with its probability. 5 of the 10 tokens are marked 1, so P(X = 1) = 1/2.
Every number this week is the crew's own reading from Nova's Run Log, not a fact about any real race.
| Pennants, X | Tokens | Probability |
|---|---|---|
| 1 | 5 | 1/2 |
| 2 | 3 | 3/10 |
| 3 | 2 | 1/5 |
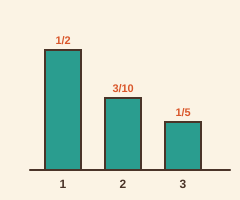
The distribution is graphed like a data set: values across, probabilities up. The bars add to 1 instead of to a count.
A solved problem to study
Here is how Wren finds the expected value, the mean of the distribution.
- Multiply each value by its probability: 1 × 1/2, 2 × 3/10, 3 × 1/5.
- That gives 1/2, 3/5 and 3/5.
- Add them: 17/10 = 1.7.
- Read it back: over many draws, the mean is 1.7 pennants per finisher. No single token shows 1.7.
- For 40 finishers, expect about 1.7 × 40 = 68 pennants in all.
Expected value is a weighted mean. Common values weigh more because their probabilities are larger.
- Read the question.
- Tap your answer.
A token shows 1 pennant with probability 1/2, 2 with probability 3/10, 3 with probability 1/5. What is the expected value, in pennants?| Statement | True or false? |
|---|---|
| 1/2 + 3/10 + 1/5 = 1 | ? |
| A random variable gives each outcome a number. | ? |
| An expected value must be one of the values the variable can take. | ? |
| 1 × 1/2 + 2 × 3/10 + 3 × 1/5 = 1.7 | ? |
Draw one, write it down, put it back. Do it ten times and find the mean of your ten numbers.
A strong start. Tomorrow two kinds of probability feed a distribution: counted from a sample space, or taken from a tally.