Wednesday
Wednesday: Data Lab, Ten Rounds of Ten Flips
"Lab day," Comet says, setting a coin and a tally sheet on the picnic table. "Ten flips make one round."
"Count the heads each round," Wren says. "Ten rounds. Then we plot the ten counts. What do you notice?"
Nova keeps the Run Log. Round by round the counts land: 4, 6, 5, 3, 7, 5, 4, 6, 5, 8.
"5.3 heads on average," Wren says. "The model said 5. Close."
"And one round hit 8," Comet says. "That felt wild while it happened."
"Still inside 1.8 to 8.2," Wren says. "Wild and ordinary at the same time."
Nova glows. "Would you like a hint? A dot plot of the ten counts shows the model's shape in your own hands."
"Then we draw it," Comet says. "And tomorrow we test a model that is not about coins."
What you need
- A coin, your Run Log and a pencil.
- Graph paper for a dot plot from 0 to 10.
- A flat surface so the coin lands and stays. The picnic table or a desk is fine.
Flip the coin low over the table so it does not roll away. Pick up any dropped coin so no one slips.
Any cutting is scissors on paper or cardboard. Nothing heavy is lifted alone.
Run the lab
- Draw a tally sheet with 10 rows for one round. Flip the coin 10 times and mark H or T on each row.
- Count the heads and write the count in your Run Log. That is round 1.
- Repeat for 10 rounds in all. You will have 10 head counts.
- Make a dot plot of the 10 counts on a number line from 0 to 10.
- Find the mean of your counts and compare it with the expected count 5.
- Mark the ordinary band 1.8 to 8.2 on your plot. Count how many of your rounds landed inside it.
The crew's lab results
The crew's 10 counts are made up for the Run Log. Yours will differ, and the comparison is the point.
| Round | 1 | 2 | 3 | 4 | 5 | 6 | 7 | 8 | 9 | 10 |
|---|---|---|---|---|---|---|---|---|---|---|
| Heads | 4 | 6 | 5 | 3 | 7 | 5 | 4 | 6 | 5 | 8 |
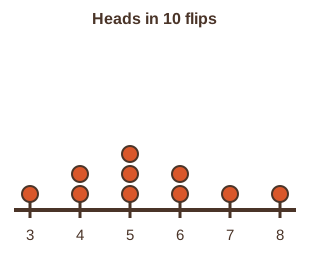
The crew's mean count is 5.3, near the model's 5. Every round landed inside 1.8 to 8.2.
The shape bunches in the middle and thins at the ends, like Tuesday's bar graph. Ten rounds is a small sample, so the match is rough.
- Read the question.
- Tap your answer.
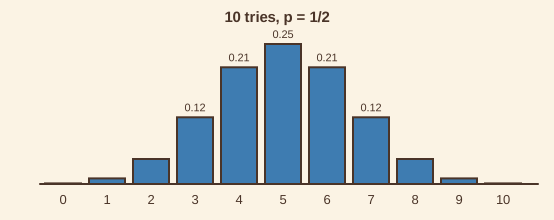 The model expects 5 heads in 10 flips. One round gave 8. Is that round consistent with the model?
| Statement | True or false? |
|---|---|
| Every one of the crew's 10 rounds landed inside the ordinary band. | ? |
| 53 ÷ 10 = 5.3 | ? |
| A round with 8 heads proves the coin is unfair. | ? |
| More rounds would make the dot plot look more like the model's bar graph. | ? |
Good lab work. Tomorrow the crew tests a bolder claim: a pacing plan that says it works 4 times in 5.