Thursday
Testing a Claimed Rate
"New model," Comet says, pinning the pacing plan to the board. "It claims a runner holds the planned lap 4/5 of the time."
"Then in 10 laps we expect 8 on-pace laps," Wren says. "Let us check the Run Log."
Nova scrolls. "The crew's 10 laps on Tuesday: 5 were on pace."
"5 instead of 8," Comet says. "Is that just chance? What do you notice about the spread?"
"√(10 × 4/5 × 1/5) is about 1.26," Wren says. "So 5 is about 2.4 standard deviations below."
"More than two," Comet says. "The plan's claim is in trouble."
Nova glows. "Would you like a hint? A surprising result questions the model. It does not prove a new one."
"Then we write down what we saw, and we test the plan again," Wren says.
Judging a claimed rate
A claimed rate is a model: "this works with probability p". The crew checks it the same way as the coin.
Expected count n × p = 10 × 4/5 = 8. Spread √(n p (1 - p)) = √(10 × 4/5 × 1/5) ≈ 1.26.
The crew saw 5. That is (8 - 5) ÷ 1.26 ≈ 2.4 standard deviations below the expected count. Beyond 2: surprising.
A surprising result means the model and the data disagree. The crew doubts the claim and tests again with more laps.
| Claim | n | Expected n × p | Spread | Seen | Judgment |
|---|---|---|---|---|---|
| fair coin, p = 1/2 | 10 | 5 | 1.58 | 3 | consistent |
| pacing plan, p = 4/5 | 10 | 8 | 1.26 | 5 | surprising |
- Read the question.
- Tap your answer.
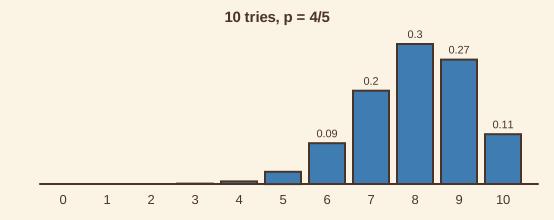 The plan claims 4/5 of laps are on pace. In 10 laps the crew saw 5. Is that consistent with the claim?
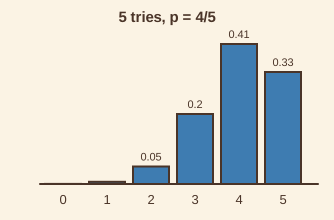 If the plan's claim of 4/5 is true, what is the probability all 5 of 5 laps are on pace?If the plan's claim of 4/5 is true, what is the probability at least 4 of 5 laps are on pace?
How to build a distribution from a sample space
The procedure behind every table this week. Read it first, then put it in order.
- List the sample space: every order the tries can come out, and check they are equally likely or know each one's probability.
- Define the random variable: the number you count in each outcome, such as heads.
- Group the outcomes by the value of the random variable.
- Find each group's probability: its count over the total, or the sum of its outcome probabilities.
- Write the table of values and probabilities, and check they add to 1.
- Find the expected value: each value times its probability, added up.
- ?List the sample space of outcomes
- ?Write the table and check the probabilities add to 1
- ?Group the outcomes by the value counted
- ?Find each group's probability
- ?Find the expected value
- ?Define the random variable (what to count)
- Read the question.
- Tap your answer.
| Statement | True or false? |
|---|---|
| 10 × 4/5 = 8 | ? |
| A result more than 2 standard deviations from the expected count is surprising under the model. | ? |
| A surprising result proves exactly what the true rate is. | ? |
| The same two-standard-deviation rule works for a coin and for a claimed rate. | ? |
Careful thinking. Tomorrow you take the model test into everyday life and review the week.