Tuesday
Tuesday: The Distribution, Two Ways
"Ten laps today, ten flips," Comet says, smoothing the tally sheet. "Before we flip, what should we expect?"
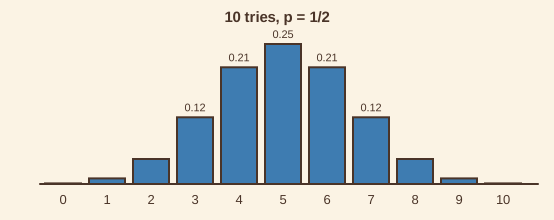
"Half of 10 is 5 heads," Wren says. "But not exactly 5 every time. What do you notice about the bar graph?"
Nova lifts the graph for 10 flips. "Would you like a hint? Most of the bars sit between 2 and 8."
"So the model expects about 5, give or take," Comet says. "How much give or take?"
"The spread is the square root of n times p times 1 - p," Wren says. "√(10 × 1/2 × 1/2) ≈ 1.58."
"Two of those on each side," Comet says. "1.8 to 8.2. So 2 through 8 heads is ordinary."
They flip. T, T, T, T, T, H, T, H, H, T. "3 heads," Wren says. "Inside the band. The coin is behaving."
Way 1: list the orders by count
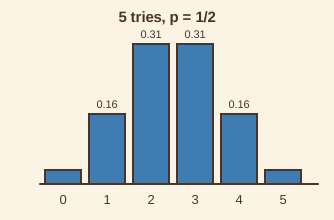
Write all 32 orders of 5 flips and sort them by how many heads they hold. The counts are 1, 5, 10, 10, 5, 1.
Each order has probability 1/32, so the probability of k heads is the count of orders over 32.
This way shows where the probabilities come from. It is slow for ten flips, so the crew has a second way.
Way 2: the formula
P(exactly k heads in n flips) = C(n, k) × p^k × (1 - p)^(n - k).
C(n, k) counts the orders with k heads. The powers multiply p once for each head and 1 - p once for each tail.
For 5 flips and 2 heads: C(5, 2) × (1/2)^2 × (1/2)^3 = 10/32 = 5/16. Both ways agree.
The expected count and its spread
A random variable gives each outcome a number. Here X is the number of heads. Its distribution is the table from Monday.
The expected value of X is each value times its probability, added up. For 5 flips it comes to 2.5, which is n × p.
The spread is the standard deviation √(n p (1 - p)). For 10 flips: √(10 × 1/2 × 1/2) ≈ 1.58.
The crew's rule: a count within 2 standard deviations of the expected count is ordinary. For 10 flips, that is 1.8 to 8.2.
| Flips n | Expected heads n × p | Spread √(n p (1 - p)) | Ordinary band |
|---|---|---|---|
| 5 | 2.5 | 1.12 | 0.3 to 4.7 |
| 10 | 5 | 1.58 | 1.8 to 8.2 |
| 20 | 10 | 2.24 | 5.5 to 14.5 |
- Read the question.
- Tap your answer.
 X is the number of heads in 5 fair flips, with probabilities 1/32, 5/32, 10/32, 10/32, 5/32, 1/32. What is the expected value of X?The fair-coin model expects 5 heads in 10 flips. The crew saw 3. Is that consistent with the model?
- Read the question.
- Tap your answer.
| Statement | True or false? |
|---|---|
| 10 × 1/2 = 5 | ? |
| 3 heads in 10 flips is within two standard deviations of 5. | ? |
| The expected count is the only count a fair coin can give. | ? |
| The probabilities in a distribution add to 1. | ? |
Is your count inside 1.8 to 8.2? Write one sentence about what that means for the coin.
Two ways that agree. Tomorrow is Data Lab: you run the pacing trial ten times and see the distribution for yourself.