Wednesday
Wednesday: Data Lab, r From Pure Chance
"Ten tokens, numbered 1 to 10," Comet says, shaking the cloth bag. "Draw one for x, put it back, draw one for y."
"Eight points, no reason for any pattern," Wren says. He draws. "3 and 7." Again. "8 and 2."
Eight pairs later Nova plots the cloud. "Would you like a hint? Guess r before you look."
"Zero," Comet says. "Pure chance." Nova glows the number: -0.21.
"Not zero," Wren says. "Small, but not zero. What do you notice? Eight random points still make a little tilt."
They reshuffle and draw eight more. This time r is 0.05. "Different tilt, still small," Comet says.
"So a small r can happen by chance alone," Wren says. "A big r is much harder to get from a bag."
What you need
- A cloth bag or cup with ten tokens or paper scraps numbered 1 to 10.
- Graph paper, a pencil, a calculator or spreadsheet that finds r, and your Run Log.
- A partner to record, and a grown-up who knows where you are.
Cut paper scraps with scissors on paper. Nothing heavy is lifted alone.
Any running or walking this week is on the park loop or a safe path, never a road. A grown-up is aware and water is at hand.
Run the lab
- Shake the bag. Draw a token for x and write it down. Put it back and shake.
- Draw a token for y and write it down. Put it back. That is one point.
- Repeat until you have eight points. Plot them on graph paper, x across and y up.
- Guess r from the look of the cloud. Then find r with a calculator or spreadsheet.
- Shake, draw eight new points, and find r again. Repeat a third time if you have time.
- Write all your r values in a row. Most should be small. Notice how they differ.
The crew's lab log
Here are the crew's own two rounds from Nova's Run Log. Yours will differ, and that is the point.
| Round | Points (x, y) | r |
|---|---|---|
| 1 | (3, 7) (8, 2) (5, 5) (1, 9) (6, 4) (9, 8) (2, 3) (7, 6) | -0.21 |
| 2 | (3, 2) (8, 7) (5, 9) (1, 5) (6, 3) (9, 6) (2, 8) (7, 4) | 0.05 |
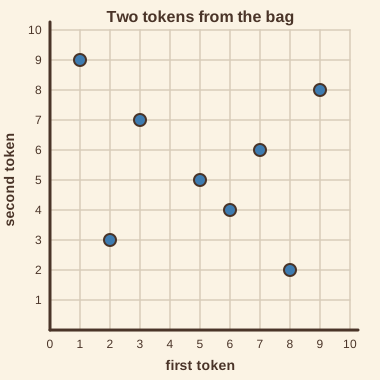
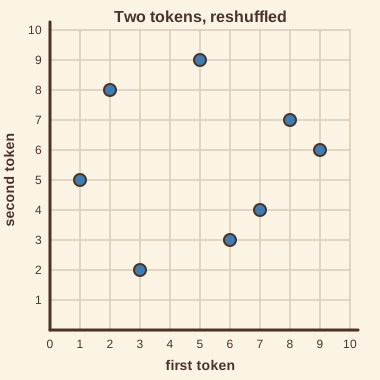
Random pairs have nothing linking x to y, yet r is rarely exactly 0. Chance alone makes a small tilt.
That is why the crew calls a size under 0.3 "little or none". It is the range chance can reach with a few points.
A size like 0.98 is far outside what the bag produced. Something real links practice and laps.
- Read the question.
- Tap your answer.
Round 1 of the token lab gave r = -0.21. How would you describe the linear relationship?Round 1 points: (3, 7), (8, 2), (5, 5), (1, 9), (6, 4), (9, 8), (2, 3), (7, 6). What is r? (Round to 2 places.)| Statement | True or false? |
|---|---|
| Random pairs from a bag give r exactly 0 every time. | ? |
| A size of r under 0.3 is within the range chance often produces with a few points. | ? |
| 8 + 8 = 16 | ? |
| Putting the token back before the second draw keeps every draw the same. | ? |
Good lab work. Tomorrow the formula for r, step by step, and the big question: does a strong r prove a cause?