Thursday
Thursday: The Formula, and the Cause Question
"Here is the inside of r," Wren says, chalking four points. "Means, standard deviations, z-scores, products, average."
Comet works through it. "Mean x 2.5, mean y 3.5. Standard deviations 1.12 each, dividing by n like week 1."
"Each point gets two z-scores," Wren says. "Multiply them. Add the four products. Divide by 4. r = 0.8."
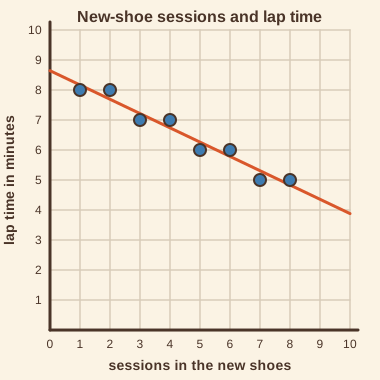
"Now the shoe chart," Comet says, pinning a sign. "Sessions in the new club shoes against lap time. Strong and falling."
"So the shoes make runners faster!" she says.
Nova glows a question mark over the sign. "Would you like a hint? Who ran the most sessions in the shoes?"
"The runners who have practiced longest," Wren says. "Practice is hiding behind the shoes. A lurking variable."
"A correlation is not proof of a cause," Comet says. "Only an experiment could test the shoes."
How r is computed
The formula for r, on four of the crew's points. Read the steps, then put them in order below.
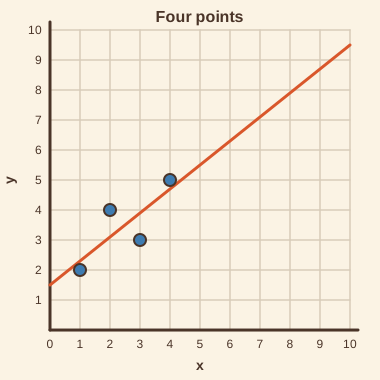
- Find the mean of x and the mean of y: 2.5 and 3.5.
- Find the standard deviation of x and of y, dividing by n: 1.12 and 1.12.
- Turn each x into a z-score, value minus mean over standard deviation: -1.34, -0.45, 0.45, 1.34.
- Turn each y into a z-score the same way: -1.34, 0.45, -0.45, 1.34.
- Multiply each point's two z-scores: 1.8, -0.2, -0.2, 1.8.
- Add the products and divide by n: 3.2 ÷ 4 = 0.8. That is r.
A matching pair of z-scores, both positive or both negative, gives a positive product. That is Tuesday's corner rule in numbers.
- ?Find the mean of x and the mean of y
- ?Add the products and divide by n to get r
- ?Multiply each point's two z-scores
- ?Turn every x and every y into a z-score
- ?Find the standard deviation of x and of y
Correlation is not causation
A strong r says two variables move together in the data. It does not say one makes the other happen.
A lurking variable is a third factor, not on the plot, that could drive both. Here, weeks of practice drives both shoe sessions and lap time.
Sometimes the direction is backwards: maybe faster runners choose to run more sessions, not the other way round.
Only a randomized experiment can show a cause: the crew would assign shoes by a fair draw, then compare lap times.
| Claim | Careful statement |
|---|---|
| "New shoes make runners faster." | A correlation is not proof of a cause. |
| "Runners with more shoe sessions also practiced longer." | A third factor, practice, could drive both. |
| "How could the crew find out?" | Assign shoes by a fair draw and compare: a randomized experiment. |
- Read the question.
- Tap your answer.
For the shoe chart, r = -0.98. How would you describe the linear relationship?| Statement | True or false? |
|---|---|
| r is the average of the products of the x and y z-scores. | ? |
| A strong r proves that x causes y. | ? |
| 3.2 ÷ 4 = 0.8 | ? |
| A lurking variable is a third factor that could drive both x and y. | ? |
Then write one "x causes y" claim you have heard and name a possible lurking variable.
Sharp thinking. Tomorrow everyday claims, a review of the week, and the fun run poster with careful words.