Tuesday
Tuesday: Reading r Two Ways
"Where does r come from?" Comet asks. "Nova gives us the number, but I want to see inside it."
"Think about where each dot sits," Wren says. "Above or below the mean of x. Above or below the mean of y."
"A dot high on both, or low on both, pulls r up," Comet says slowly. "A dot high on one, low on the other, pulls it down."
Nova draws a cross through the cloud at the two means and glows the four corners. "Would you like a hint? Count the corners."
"Practice chart: every dot sits in the up-right or down-left corner," Wren says. "So r is big and positive, 0.98."
"Warm-up chart: some dots sit in the wrong corners," Comet says. "They pull r down to 0.54."
"Two ways to read it," Wren says. "By the number, and by the corners. They agree."
Way 1: read the number
Technology computes r. You read the sign for direction and the size for strength, using the crew's cut-offs 0.3 and 0.7.
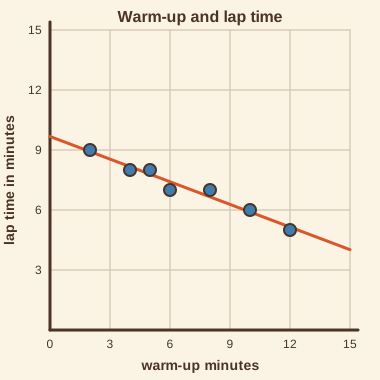
Practice: 0.98, strong positive. Warm-up minutes and laps: 0.54, weak positive. Warm-up and lap time: -0.98, strong negative.
Way 2: read the corners
Draw a vertical line at the mean of x and a horizontal line at the mean of y. The plot splits into four corners.
Dots in the up-right and down-left corners push r toward positive. Dots in the other two corners push it toward negative.
When nearly every dot sits in two matching corners, r is near 1 or -1. When the dots spread over all four, r is near 0.
The corners show why r has no units. Only which side of each mean a dot sits on matters, and how far.
| Chart | Dots in up-right or down-left | Dots in the other two corners | r |
|---|---|---|---|
| Weeks of practice and laps | 7 | 1 | 0.98 |
| Warm-up minutes and laps | 4 | 4 | 0.54 |
What r does not say
r measures only straight-line tightness. A perfect curve can have a small r, so always look at the plot too.
r says nothing about the slope's size. A gentle line and a steep line can both have r near 1.
r says nothing about cause. Two variables can move together for many reasons. That is Thursday's question.
- Read the question.
- Tap your answer.
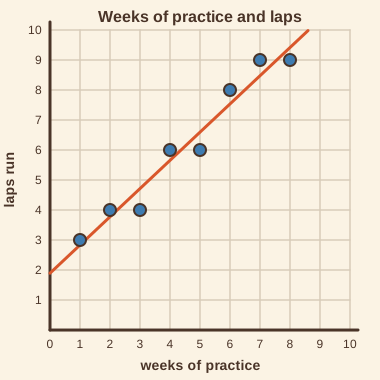 Weeks of practice against laps: (1, 3), (2, 4), (3, 4), (4, 6), (5, 6), (6, 8), (7, 9), (8, 9). What is r? (Round to 2 places.)Warm-up minutes against lap time: (2, 9), (4, 8), (5, 8), (6, 7), (8, 7), (10, 6), (12, 5). What is r? (Round to 2 places.)
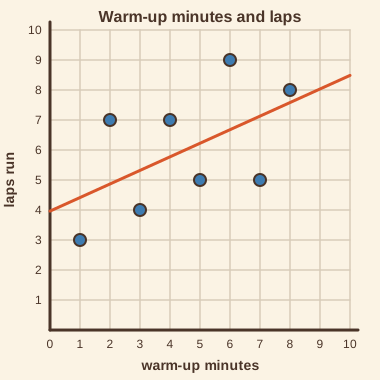 Warm-up minutes against laps: (1, 3), (2, 7), (3, 4), (4, 7), (5, 5), (6, 9), (7, 5), (8, 8). What is r? (Round to 2 places.)
- Read the question.
- Tap your answer.
For the practice chart, r = 0.98. The slope is a different number. What is the slope of the least-squares line? (Round to 2 places.)| Statement | True or false? |
|---|---|
| Dots in the up-right and down-left corners push r toward positive. | ? |
| A steep line always has a larger r than a gentle one. | ? |
| A curved pattern can have an r near 0. | ? |
| r = 0.95 proves that x causes y. | ? |
Does the chart with more matching-corner dots have the larger r? Write what you find.
Two readings that agree. Tomorrow is Data Lab: random pairs from the bag, and the r that chance alone produces.