Monday
Monday: Tight Cloud, Loose Cloud
Dusk on the loop. Wren holds up two sketches from the Run Log.
"Same eight runners," he says. "Left: weeks of practice against laps. Right: warm-up minutes against laps."
"Both climb," Comet says. "But the left one is tight. The right one is a loose cloud. What do you notice?"
"The left line fits well, the right one barely," Wren says. "I want one number that says how tight."
Nova hovers between the sketches and glows two numbers, one near 1 and one near a half. "Would you like a hint? The number is called r."
"r is 0.98 for practice," Wren reads. "And 0.54 for warm-up. Closer to 1 means tighter."
"So practice and laps go together strongly," Comet says. "Warm-up and laps, only a little."
"Together," Wren says. "Not because of. We will get to that."

One number for tightness
The correlation coefficient r measures how tightly the dots follow a straight line. It always lands between -1 and 1.
The sign of r matches the slope: positive for a rising cloud, negative for a falling one.
The size of r is the strength. Near 1 or -1, the dots hug the line. Near 0, they form no line at all.
The crew's rule: a size of 0.7 or more is strong, under 0.3 is little or none, and between is weak.
r has no units. Weeks and laps, minutes and seconds, it is the same kind of number for every scatter plot.
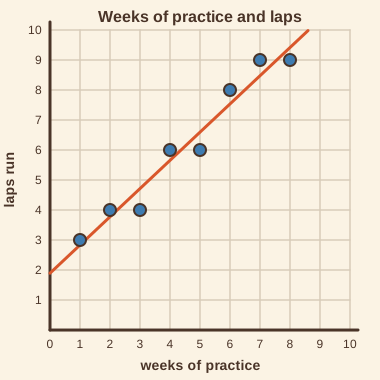
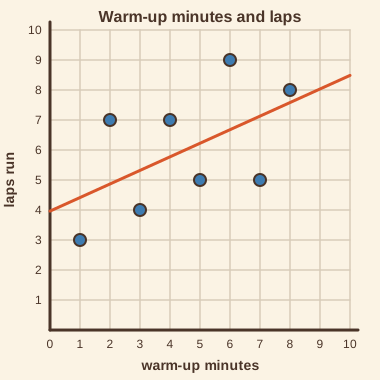
| Chart | r | Sign | Strength |
|---|---|---|---|
| Weeks of practice and laps | 0.98 | positive | strong positive |
| Warm-up minutes and laps | 0.54 | positive | weak positive |
| Warm-up minutes and lap time | -0.98 | negative | strong negative |
A solved problem to study
Here is how Wren reads r for the practice chart in three steps.
- Read the sign: r = 0.98 is positive, so laps rise with weeks of practice. The slope is positive too.
- Read the size: 0.98 is at least 0.7, so the relationship is strong. The dots stay close to the line.
- Say it in words: a strong positive linear relationship between weeks of practice and laps, in the crew's log.
Every number here is the crew's own made-up Run Log reading. Technology finds r; the crew reads it.
- Read the question.
- Tap your answer.
For weeks of practice against laps, r = 0.98. How would you describe the linear relationship?For warm-up minutes against laps, r = 0.54. How would you describe the linear relationship?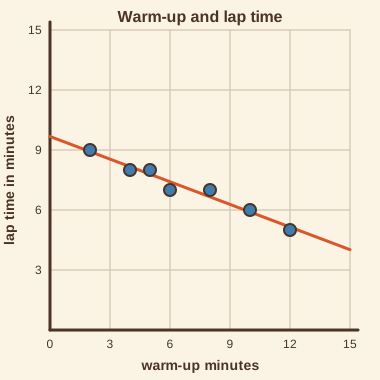 For warm-up minutes against lap time, r = -0.98. How would you describe the linear relationship?
| Statement | True or false? |
|---|---|
| r is always between -1 and 1. | ? |
| A negative r means the dots fall from left to right. | ? |
| r has units, such as laps per week. | ? |
| An r of 0.54 is strong by the crew's rule. | ? |
Guess an r for each. Write your guesses in the Run Log and check them later this week.
Two clouds, two numbers. Tomorrow you see where r comes from and read it two ways.