Wednesday
Wednesday: Data Lab, the Shuttle Walk With a Stop
"Lab day," Comet says, placing two cones twenty steps apart on the grass by the bench.
"Shuttle walks," Wren says. "Cone to cone and back is one walk. Twelve of them, timed in whole seconds."
"And on one walk, stop for a sip of water at the far cone," Comet says. "On purpose. We want an outlier."
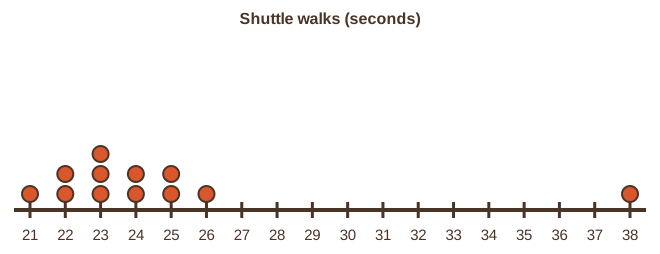
Comet walks, Wren clicks, Nova logs. "21, 22, 22, 23, 23, 23, 24, 24, 25, 25, 26, 38 seconds. The water stop was the 38."
"Fences," Wren says, working fast. "Q1 22.5, Q3 25, IQR 2.5. Upper fence 28.75. The 38 is an outlier."
Nova shows both means. "With it, 24.7. Without it, 23.5. Would you like a hint? Check the median too."
"23.5 with, 23 without," Comet says. "It moved by half a second. Now you run yours."
What you need
- A stopwatch or kitchen timer and two markers for cones (shoes or sticks work).
- Graph paper, a pencil and your Run Log. A cup of water at the far marker.
- A grown-up who knows where you are.
A grown-up knows where you are and water is at hand. Stop and rest if you feel tired or too warm.
Any cutting is scissors on paper or cardboard. Nothing heavy is lifted alone.
Run the lab
- Set two markers about twenty steps apart. One shuttle walk is out to the far marker and back.
- Time twelve shuttle walks in whole seconds. On one of them, pause at the far marker for a sip of water.
- Write the twelve times in order. Find Q1, Q3 and the IQR.
- Find both fences. Mark any value outside them as an outlier.
- Find the mean and median with every value, then again without the outlier. Record all four.
- Draw the dot plot and mark the fences with dashed lines.
The crew's lab table
The crew's twelve shuttle walks are made up for the Run Log. Yours will differ, and that is the point.
| Walk | 1 | 2 | 3 | 4 | 5 | 6 | 7 | 8 | 9 | 10 | 11 | 12 |
|---|---|---|---|---|---|---|---|---|---|---|---|---|
| Seconds | 21 | 22 | 22 | 23 | 23 | 23 | 24 | 24 | 25 | 25 | 26 | 38 |
| Measure | With the water stop | Without it |
|---|---|---|
| Mean | 24.7 | 23.5 |
| Median | 23.5 | 23 |
| Fences | 18.75 and 28.75 | 17.5 and 29.5 |
- Read the question.
- Tap your answer.
| Statement | True or false? |
|---|---|
| 25 + 1.5 × 2.5 = 28.75 | ? |
| The water stop should be reported as an outlier, not hidden in the mean. | ? |
| Removing an outlier always changes the median by a large amount. | ? |
| A normal model would fit the shuttle walks well, outlier included. | ? |
Good lab work. Tomorrow you prove why the median resists, and you learn when the normal model should not be used.