Thursday
Thursday: Why the Median Resists, and When the Bell Fails
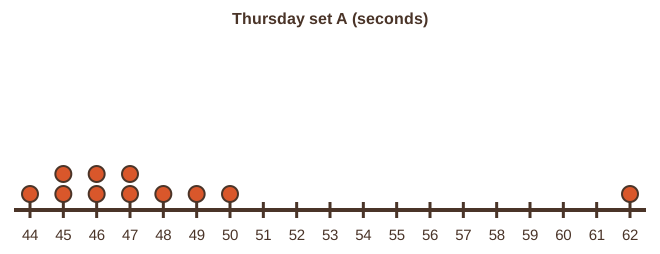
"Two sets from the log," Wren says, pinning up two dot plots. "Set A has a far value on the right."
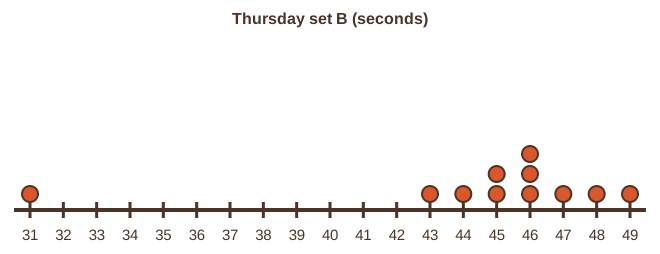
"Set B has one on the left," Comet says. "31, way below the rest. What do you notice?"
"Set A: mean 48.1, median 47. Set B: mean 44.5, median 46," Wren reads. "Pulled in opposite directions."
Nova lights the two medians. "Would you like a hint? Ask what the median actually looks at."
"Only the middle position," Comet says. "Slide the far value anywhere past the others and the middle never changes."
"That is the proof," Wren says. "And it tells us something else. A set with an outlier is not bell-shaped."
"So no normal model for sets A and B," Comet says. "Only the stretch holds earned the bell."
Two sets, two tails
| Set | Mean | Median | Fences | Outlier | Shape |
|---|---|---|---|---|---|
| A | 48.1 | 47 | 39 and 55 | 62 | skewed right |
| B | 44.5 | 46 | 39.5 and 51.5 | 31 | skewed left |
A high outlier pulls the mean up and makes the set skewed right. A low outlier pulls the mean down and makes it skewed left.
Either way the median sits with the bulk of the data, and that is where the typical value really is.
Why the median resists an outlier
- Put the values in order.
- The median is the value in the middle position, or the mean of the two middle values.
- Move the greatest value far to the right. It is still the greatest, so the order of the others does not change.
- The middle position still holds the same value, so the median does not move.
- The mean adds every value, so the far value pulls the sum and the mean toward it.
- ?The median is the middle position
- ?Put the values in order
- ?The middle position still holds the same value
- ?Move the greatest value farther out; it is still the greatest
- ?The mean adds every value, so it is pulled
When the normal model does not fit
The normal model is a bell: one peak, symmetric, with thin tails and no outlier. Fit it only to data shaped like that.
A skewed set, a set with an outlier, or a set with two peaks gives wrong percentages when forced into a bell.
Check the shape first with a dot plot or histogram. The stretch holds pass. Sets A and B do not.
- Read the question.
- Tap your answer.
- Read the question.
- Tap your answer.
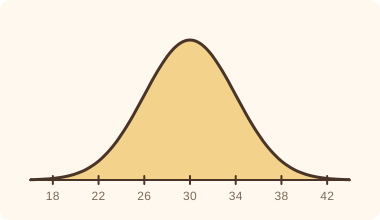 Stretch holds follow a normal model with mean 30 and standard deviation 4. About what percent fall between 18 and 42?
Careful proving. Tomorrow you put outliers and the bell to work in everyday readings around the loop.