Tuesday
Tuesday: The Bell-Shaped Normal Model
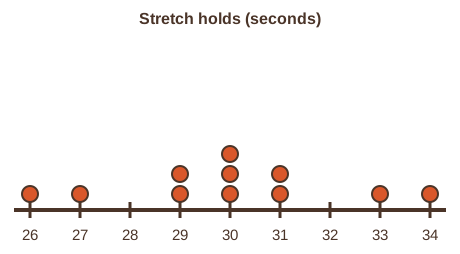
Comet fans out a stack of stretch-timing cards. "Warm-up stretch holds. Eleven from this morning: 26, 27, 29, 29, 30, 30, 30, 31, 31, 33, 34 seconds."
"Mean 30, median 30, no outlier," Wren says. "A neat little hill. What do you notice?"
"Nova has 200 of these in the log from all the weeks," Comet says. "They make the same hill, only smoother."
Nova projects the curve. "Mean 30, standard deviation 4. Would you like a hint? Count off standard deviations from the mean."
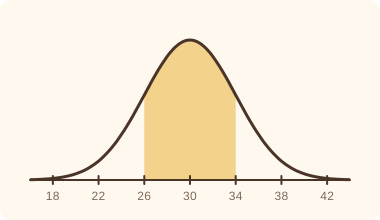
"26 to 34 is one standard deviation each way," Wren says. "About 68% of the holds land there."
"22 to 38 is two each way, about 95%," Comet says. "And three each way covers almost everything."
"That is the normal model," Wren says. "Two numbers, mean and standard deviation, and the bell draws itself."
Two ways to describe the stretch holds
Way 1 is the data itself. The eleven holds are 26, 27, 29, 29, 30, 30, 30, 31, 31, 33, 34. Mean 30, median 30, standard deviation 2.2.
Way 2 is a model. The crew's long log of 200 holds bunches around a mean of 30 with standard deviation 4. A bell curve stands in for all of them.
The data is exact but lumpy. The model is smooth and lets the crew estimate percentages without counting every card.
The 68-95-99.7 rule
In a normal model, about 68% of values fall within 1 standard deviation of the mean. About 95% fall within 2, and 99.7% within 3.
For the stretch log: 68% between 26 and 34, 95% between 22 and 38, 99.7% between 18 and 42.
The bands on each side are 34%, 13.5% and 2.35%. The two tails beyond 3 standard deviations hold the last 0.3% together.
| Band | Seconds | Percent of the model | About how many of 200 |
|---|---|---|---|
| Within 1 standard deviation | 26 to 34 | 68% | 136 |
| Within 2 standard deviations | 22 to 38 | 95% | 190 |
| Within 3 standard deviations | 18 to 42 | 99.7% | 199 |
The z-score
A z-score tells how many standard deviations a value sits from the mean: z = (value - mean) ÷ standard deviation.
A 38-second hold has z = (38 - 30) ÷ 4 = 2. A 26-second hold has z = -1.
Positive z means above the mean. Negative z means below. A z-score past 2 or -2 is unusual in a normal model.
- Read the question.
- Tap your answer.
Stretch holds follow a normal model with mean 30 and standard deviation 4. About what percent fall between 26 and 34?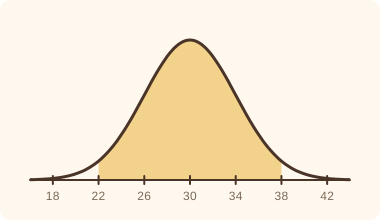 Stretch holds follow a normal model with mean 30 and standard deviation 4. About what percent fall between 22 and 38?
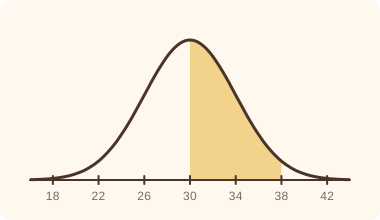 Stretch holds follow a normal model with mean 30 and standard deviation 4. About what percent fall between 30 and 38?
- Read the question.
- Tap your answer.
| Statement | True or false? |
|---|---|
| (38 - 30) ÷ 4 = 2 | ? |
| A z-score of -1 means the value is one standard deviation below the mean. | ? |
| In the stretch model, about half of the holds are above 30 seconds. | ? |
| The normal model needs the median and IQR to draw the bell. | ? |
Label the bands 34%, 13.5% and 2.35% on each side of the mean.
A bell from two numbers. Tomorrow is Data Lab: your own shuttle walks, your own fences, your own shape.