Friday
Friday: Everyday Outliers and Bells
"The sign-up table wants a typical lap time for the poster," Comet says. "Which number do I give them?"
"Wednesday's laps have the shoe stop," Wren says. "So the median, 56. Not the mean, 57.3."
"And a note that one lap included a stop," Comet says. "Report the outlier, do not bury it."
Nova shows the stretch bell again. "Would you like a hint? The poster could say most holds last 26 to 34 seconds."
"About 68% of them," Wren says. "That is a sentence anyone can read, built from two numbers."
"And a 38-second hold is unusual," Comet says. "z-score 2. Only about 2.5% hold longer."
"Fences for the laps, a bell for the stretches," Wren says. "Shape decides which tool you reach for."
Reporting with an outlier
When a set has an outlier, report the median and IQR, and say what the outlier was. Readers deserve both facts.
For Comet's laps: "Median 56 seconds, IQR 2.5. One lap of 72 seconds included a shoe stop."
Reporting the mean of 57.3 alone would make Comet look slower than she ran on eleven of twelve laps.
Reporting with a normal model
When a set is bell-shaped, the mean and standard deviation do the job. "Stretch holds: mean 30 seconds, standard deviation 4."
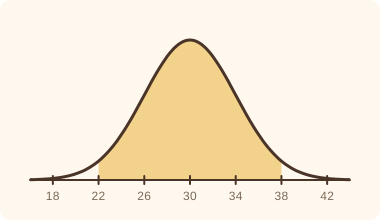
From those two numbers: about 68% of holds between 26 and 34, about 95% between 22 and 38.
A hold above 38 seconds has a z-score above 2. About 2.5% of holds are that long.
Review: the week in one table
| Situation | Tool | What to report |
|---|---|---|
| One value far from the rest | 1.5 × IQR rule | median, IQR and the outlier |
| Bell-shaped, no outlier | normal model | mean, standard deviation and a percent |
| Skewed or two peaks | dot plot or histogram | median and IQR, no bell |
- Fences: Q1 - 1.5 × IQR and Q3 + 1.5 × IQR. Outside is an outlier.
- Outliers pull the mean and standard deviation. The median and IQR resist.
- Normal model: 68% within 1 standard deviation, 95% within 2, 99.7% within 3.
- z = (value - mean) ÷ standard deviation. Fit the bell only to bell-shaped data.
- Read the question.
- Tap your answer.
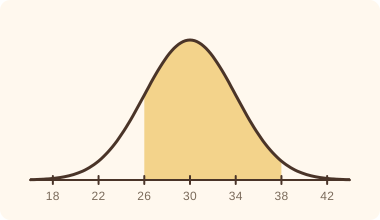 Stretch holds follow a normal model with mean 30 and standard deviation 4. About what percent fall between 26 and 38?
- Read the question.
- Tap your answer.
| Statement | True or false? |
|---|---|
| Reporting the median and naming the outlier is more honest than reporting the mean alone. | ? |
| (40 - 30) ÷ 4 = 2.5 | ? |
| A z-score can never be negative. | ? |
| About 95% of the stretch holds fall between 22 and 38 seconds in the model. | ? |
Read both aloud. Each should name the center, the spread and any outlier or percent.
A full week of fences and bells. Tomorrow is Track Day: find an outlier in your own family's data.