Thursday
Thursday: Comparing Two Runners
"My laps against yours," Comet says, laying two sheets side by side. "Same morning, same short loop."
Wren reads his own times. "49, 52, 54, 55, 57, 57, 57, 59, 60, 62, 65. Median 57, same as your mean. What do you notice?"
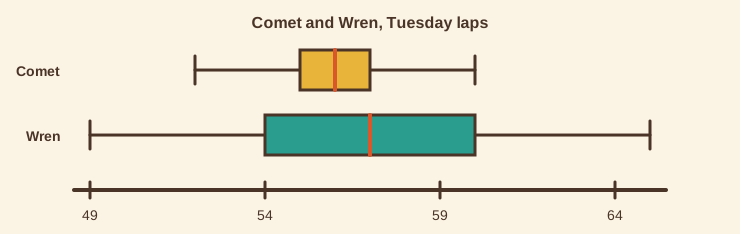
"Your box is wider," Comet says. "Your IQR is 6 and mine is 2. Same center, three times the spread."
"Standard deviation says the same thing," Wren says. "Mine is 4.3, yours is 2. I speed up and slow down."
Nova shows two box plots on one number line. "Would you like a hint? Look at the warm-up jog times too."
"The first morning has a long tail to the right," Comet says. "A few slow jogs pull the mean above the median."
"Skewed right," Wren says. "For a skewed set, report the median and IQR. They do not get pulled by the tail."
Two box plots, one number line
To compare two groups, put both box plots on the same scale. Compare the centers first, then the spreads.
| Runner | Mean | Median | Standard deviation | IQR |
|---|---|---|---|---|
| Comet | 56 | 56 | 2 | 2 |
| Wren | 57 | 57 | 4.3 | 6 |
Both runners center near 56 seconds. Wren's spread is larger by both measures, so his pace varies more from lap to lap.
Shape decides which measures to report
A symmetric set has a hill that is even on both sides. The mean and median agree, so report the mean and standard deviation.
A skewed set has a long tail on one side. The tail pulls the mean toward it, but the median stays put.
Skewed right: the tail points to larger values and the mean is above the median. Skewed left: the tail points to smaller values.
For a skewed set, report the median and IQR. They are built from positions, so a long tail cannot drag them.
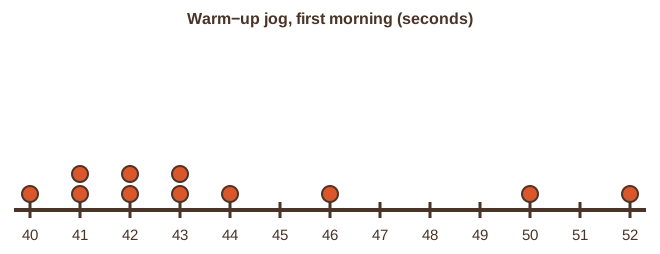
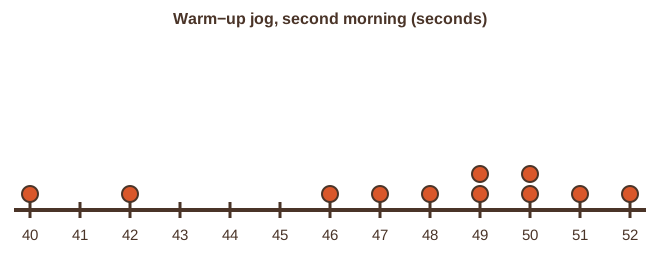
| Morning | Mean | Median | Shape |
|---|---|---|---|
| First | 44 | 43 | skewed right |
| Second | 47.6 | 49 | skewed left |
- Read the question.
- Tap your answer.
- Read the question.
- Tap your answer.
How the standard deviation is built
- Find the mean of the values.
- Subtract the mean from each value to get its distance from the mean.
- Square each distance so that no distance is negative.
- Add the squared distances and divide by n, the number of values.
- Take the square root to return to the original units.
- ?Find the mean
- ?Subtract the mean from each value
- ?Square each distance
- ?Add the squares and divide by n
- ?Take the square root
Careful comparing. Tomorrow you find shape, center and spread in everyday counts around the loop.