Wednesday
Wednesday: Data Lab, Twelve Walking Laps
"Lab day," Comet says, setting two cones at the ends of the short path by the fountain.
"Walking laps today, not running," Wren says. "Twelve of them. A grown-up is at the bench with the water."
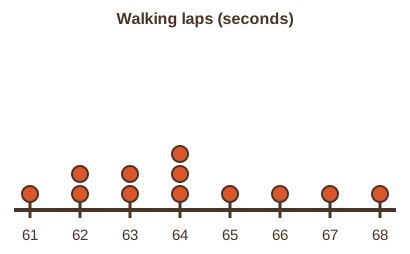
Comet walks the path twelve times while Wren clicks the stopwatch. Nova logs each time. "61, 62, 62, 63, 63, 64, 64, 64, 65, 66, 67, 68 seconds."
"What do you notice?" Wren asks, stacking the dots.
"Tight," Comet says. "Everything from 61 to 68. A walk is steadier than a run."
Nova shows the five-number summary. "Would you like a hint? The box will be narrow, and that is the point."
"Median 64, IQR 3," Wren says. "A small spread means a steady pace. Now you collect your own."
What you need
- A stopwatch or a kitchen timer, two markers for the ends of a short path (cones, shoes or sticks).
- Graph paper, a pencil and your Run Log.
- A grown-up who knows where you are, and water at hand.
A grown-up knows where you are and water is at hand. Stop and rest if you feel tired or too warm.
Any cutting is scissors on paper or cardboard. Nothing heavy is lifted alone.
Run the lab
- Mark a short path, about 40 steps long. Walk it at your normal pace twelve times.
- Time each lap in whole seconds and write the twelve times in your Run Log.
- Put the times in order. Draw a dot plot on a number line from your least to your greatest.
- Find the median, the quartiles and the IQR. Draw the box plot under the dot plot.
- Find the mean. Then find each distance from the mean, square it, average the squares and take the square root.
- Write one sentence about the shape and one about the spread.
The crew's lab table
The crew's twelve walking laps are made up for the Run Log. Yours will differ, and that is fine.
| Lap | 1 | 2 | 3 | 4 | 5 | 6 | 7 | 8 | 9 | 10 | 11 | 12 |
|---|---|---|---|---|---|---|---|---|---|---|---|---|
| Seconds | 61 | 62 | 62 | 63 | 63 | 64 | 64 | 64 | 65 | 66 | 67 | 68 |
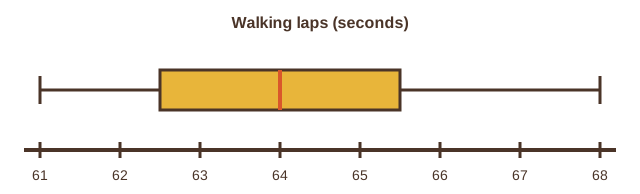
With 12 values, the median is the mean of the 6th and 7th: 64. The lower half has six values, so its median is the mean of two: 62.5.
- Read the question.
- Tap your answer.
| Statement | True or false? |
|---|---|
| A smaller IQR means the middle half of the data is packed more tightly. | ? |
| 68 - 61 = 7 | ? |
| A walking lap time is a value on a number line, so it can go on a dot plot. | ? |
| With 12 values, the median is the 6th value alone. | ? |
Good lab work. Tomorrow you compare two runners and learn what shape tells you about which measures to report.