Wednesday
Wednesday: Loft Lab, Time the Cart
Comet drags the sawhorses apart so the plank barely tilts. "Lab day. Gentle plank, five runs."
Wren hands her the stopwatch and a towel for the end of the ramp. "I release, you call the marks."
"Wait," Comet says. "Where do we start the clock?" She rushes to let go, then stops herself.
"At the release," Wren says. "Same start every time, or the readings will not line up."
Nova projects an empty table: seconds across the top, marks below. "Would you like a hint? Fill it as you go."
Run one: 1, 4, 7, 10, 13. Run two: 1, 4, 7, 10, 13 again. Comet grins. "Steady."
"Steady roll, steady line," Wren says. "Our engineer, run the lab, then compare your rate with ours."
What you need
- A long plank or board on two low supports, tilted only a little, with a folded towel at the bottom.
- A small toy cart or any small wheeled toy, and masking tape for marks every 10 centimeters.
- A stopwatch or a phone timer, and a helper to call the marks while you keep time.
- Your Loft Log, graph paper and a ruler.
Keep the tilt gentle so the cart rolls, never flies. The towel at the end stops it.
Nothing is thrown or dropped from a height, and the cart stays on the plank.
Run the lab
- Tape marks along the plank every 10 centimeters and number them from 0 at the top.
- Hold the cart with its front wheels at mark 1. Start the timer the moment you let go.
- Have your helper call out the mark the cart is passing at each second. Write every reading down.
- Repeat for five runs from the same start. Keep the plank at the same tilt.
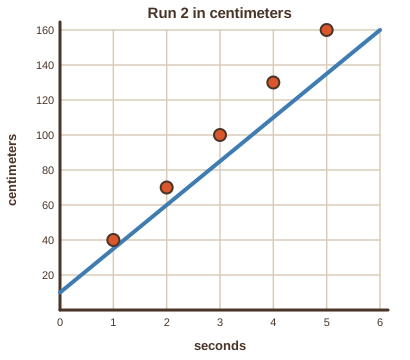
- Plot seconds across and marks up, with labels and a scale. Lay a ruler along the dots.
- Find your rate of change from two readings. Then compare it with the crew's rate of 3 marks a second.
The crew's lab log
Here are the crew's own readings for two runs on the gentle plank. Both are their made-up Loft data for this lesson.
| Seconds | Run 1 (marks) | Run 2 (marks) | Run 2 (centimeters) |
|---|---|---|---|
| 0 | 1 | 1 | 10 |
| 1 | 4 | 4 | 40 |
| 2 | 7 | 7 | 70 |
| 3 | 10 | 10 | 100 |
| 4 | 13 | 13 | 130 |
- Read the question.
- Tap your answer.
| Statement | True or false? |
|---|---|
| Starting the timer at the same moment every run keeps the readings lined up. | ? |
| A steeper plank would give a bigger rate of change. | ? |
| The point (3, 100) is on the graph of y = 30t + 10. | ? |
| The point (2, 60) is on the graph of y = 30t + 10. | ? |
| 130 - 40 = 30 × 3 | ? |
Keep the tilt gentle and the towel in place every time.
Fine lab work, engineer. Tomorrow the crew compares three runs from their own data and finds a line that is not straight.