Tuesday
Tuesday: Graphs by Hand, Up and Down
Comet props a clear jug on the bench. Twelve lines are drawn up its side, and a thin tube drains it.
"Twelve lines full. It drops two lines a minute," she says. "What can we make from that?"
"A rule," Wren says. "Lines left: L = 12 - 2t. What do you notice about the sign?"
"Minus two. The level is dropping, so the rate is negative." Comet sketches a line sloping down.
Nova projects the sketch next to yesterday's cart graph. One climbs, one falls.
"Would you like a hint?" she asks. "Where does the falling line reach zero?"
"When the jug is empty," Comet says. "12 - 2t = 0, so t = 6. Six minutes."
Wren labels the axes. "Minutes across, lines up, one square each. Our engineer, your turn to graph."
Graph a linear rule in four moves
- Draw and label the axes. Write what one square means on each axis (the scale).
- Plot the y-intercept: the output when the input is 0.
- Use the rate of change to step to a second point. Up for a positive rate, down for a negative one.
- Lay a ruler through both points, draw the line, and mark where it crosses each axis.
For the jug, L = 12 - 2t: start at (0, 12). Each minute go right 1 and down 2. The line reaches zero at t = 6.
That point, (6, 0), is the t-intercept. For the jug it means empty after 6 minutes.
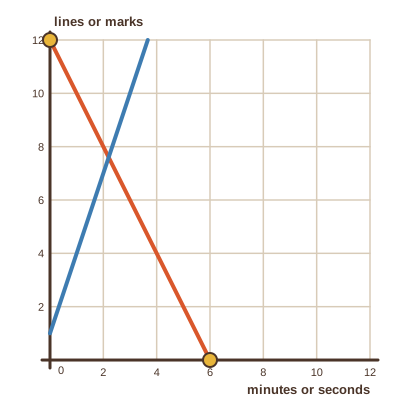
Key features to read
- Increasing: the output rises as the input grows. The slope is positive. The cart.
- Decreasing: the output falls as the input grows. The slope is negative. The jug.
- y-intercept: the output at input 0. Horizontal intercept: the input where the output is 0.
- Positive where the graph is above the axis, negative where it is below. The jug is positive until t = 6.
Two ways to find the rate of change
From a table: pick two rows, divide the change in output by the change in input.
From a rule: read the number multiplying the input. Both ways agree for a line, so use whichever you have.
Table check for the jug: from t = 1 to t = 4, L goes from 10 to 4. That is a change of -6 over 3 minutes, so -2 a minute.
| Minutes (t) | Lines left (L = 12 - 2t) |
|---|---|
| 0 | 12 |
| 1 | 10 |
| 2 | 8 |
| 3 | 6 |
| 4 | 4 |
| 5 | 2 |
| 6 | 0 |
- Read the question.
- Tap your answer.
- Read the question.
- Tap your answer.
- Read the question.
- Tap your answer.
- ?Step right 1 and down 2 to reach (1, 10)
- ?Draw the line through both points and mark where it meets the axis at (6, 0)
- ?Draw the axes, label them minutes and lines, and write the scale
- ?Plot the y-intercept at (0, 12)
| Statement | True or false? |
|---|---|
| The graph of L = 12 - 2t is decreasing. | ? |
| The y-intercept of L = 12 - 2t is 6. | ? |
| The point (3, 6) is on the graph of y = 12 - 2t. | ? |
| The point (5, 1) is on the graph of y = 12 - 2t. | ? |
| Two points from a table are enough to find the rate of change of a line. | ? |
| 12 - 2 × 6 = 0 | ? |
Circle each intercept and write what it means for the cart or the jug.
Excellent graphing. Tomorrow is Loft Lab: the stopwatch comes out and you time the cart yourself.