Thursday
Thursday: Three Runs, Three Lines
Wren pins three tables to the corkboard. "Run A, gentle plank. Run B, gentle plank with a push. Run C, middle plank."
"Same seconds, different centimeters," Comet says. "What can we make of them?"
"Three rules," Wren says. "What do you notice about run B's start?"
"Same start as A, 10 centimeters. But it gains 40 a second instead of 30. The push changed the rate, not the start."
Nova projects all three as lines on one grid. "Would you like a hint? Look at run C's first row."
"Zero at zero," Comet says. "Run C started right on the line, so its intercept is 0."
Then Wren flips a fourth card: the steep plank. 0, 5, 20, 45, 80. "That one is not a line at all."
"The rate keeps growing," Comet says. "Our engineer, what is the average rate between 1 and 3 seconds?"
The crew's Thursday data
Every number here is the crew's own made-up timing from the Loft, in centimeters past the start line.
| Seconds | Run A, gentle plank | Run B, gentle plank, pushed | Run C, middle plank |
|---|---|---|---|
| 0 | 10 | 10 | 0 |
| 1 | 40 | 50 | 50 |
| 2 | 70 | 90 | 100 |
| 3 | 100 | 130 | 150 |
| 4 | 130 | 170 | 200 |
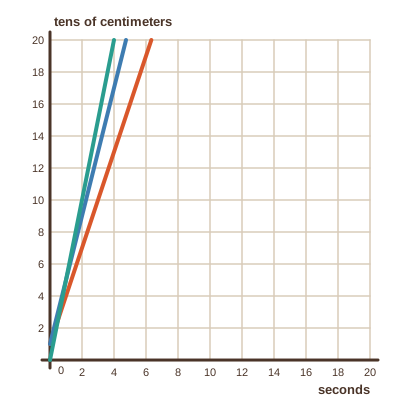
The graph is drawn in tens of centimeters so the lines fit the grid. The scale is written on the axis.
Run A: d = 30t + 10. Run B: d = 40t + 10. Run C: d = 50t. Same shape, different rate or start.
When the graph bends
On the steep plank the cart sped up. The readings 0, 5, 20, 45, 80 do not have equal steps.
You can still find an average rate of change over an interval: change in distance divided by change in time.
From 1 to 3 seconds: 45 - 5 = 40 centimeters over 2 seconds. That is the slope of the line joining those two dots.
This rule is the crew's own model from their stopwatch data, not a law. It only describes their plank.
| Seconds | Steep plank (centimeters) |
|---|---|
| 0 | 0 |
| 1 | 5 |
| 2 | 20 |
| 3 | 45 |
| 4 | 80 |
- Read the question.
- Tap your answer.
- Read the question.
- Tap your answer.
| Statement | True or false? |
|---|---|
| Runs A and B have the same y-intercept. | ? |
| Run C has a larger rate of change than run B. | ? |
| The steep-plank readings have equal steps, so they make a line. | ? |
| The point (3, 130) is on the graph of y = 40t + 10. | ? |
| The point (2, 100) is on the graph of y = 50t. | ? |
| 45 - 5 = 20 × 2 | ? |
Sharp reading, engineer. Tomorrow you find lines in everyday life and review the week.