Week 12 · Random Variables, Expected Value and Race Day
Track Day
Race Day: run the awards table
// The awards table, built from expected value
⏱ about 20 min
Race Day: Run the Awards Table
Pennants flutter along the park loop. Runners stretch on the grass, water at hand, grown-ups at every corner.
Comet holds up the bag. "8 tokens, one per runner. Fair draw for the first heat."
Wren pins the pennant chart to the awards table. "Three bars, mean 1.7. We made 68 pennants for 40 finishers."
Beside it hangs the lap chart, mean 1.9, and a stack of about 57 water cups.
Nova hovers over the table. "Would you like a hint? Explain each card in one sentence to anyone who stops."
"The draw is fair because every token is the same," Comet tells a family. "The chart says what to expect over many draws."
"Every number was our own," Wren adds. "Now you run yours at home."
"What can we make next?" Comet asks as the first heat sets off.
- A random variable numbers the outcomes. Its distribution is graphed as bars that add to 1.
- Theoretical probabilities come from counting a sample space; empirical ones come from a tally. Both have a mean.
- Expected value is each value times its probability, added up: the mean of the distribution, and the weight of a decision.
- A two-way table reads a check the right way round. A fair draw gives every outcome the same probability.
- Twelve weeks of the Run Log: every reading was the crew's own, and every answer was computed.
◇ YOUR RACE DAY TABLE
Set up a table at home with three cards: a fair draw, a data display and an expected-value chart.
Card 1: put one identical token per family member in a bag. Draw for the first turn at a game. Explain why the draw is fair.
Card 2: time each family member on a short walk around the yard or block, with a grown-up aware. Draw a dot plot of the times.
Card 3: show your Wednesday pennant chart with its expected value. Draw from a 10-token bag ten times and compare the mean.
Let each family member run one card. Trade until everyone has done the draw.
Card 1: put one identical token per family member in a bag. Draw for the first turn at a game. Explain why the draw is fair.
Card 2: time each family member on a short walk around the yard or block, with a grown-up aware. Draw a dot plot of the times.
Card 3: show your Wednesday pennant chart with its expected value. Draw from a 10-token bag ten times and compare the mean.
Let each family member run one card. Trade until everyone has done the draw.
For a grown-up
This is a table activity with tokens and cards. Tokens stay on the table and away from small children.
Any walking or jogging for Card 2 happens on a safe path with a grown-up aware and water at hand. No one runs on a road.
The times and probabilities are the family's own game, not facts about any real race.
Any walking or jogging for Card 2 happens on a safe path with a grown-up aware and water at hand. No one runs on a road.
The times and probabilities are the family's own game, not facts about any real race.
RACE DAY CHECK
- Read the question.
- Tap your answer.
Card 1: 8 identical tokens give each runner a probability of 1/8. Is the draw fair?
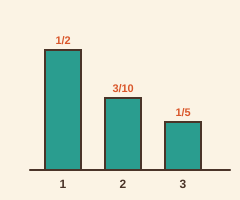 Card 3: a token shows 1, 2 or 3 pennants with probabilities 1/2, 3/10, 1/5. What is the expected value, in pennants?
The lap chart's expected value is 1.9 laps per runner. For 30 runners, how many laps in all?
Card 3 says the expected value is 1.7 pennants. For 40 finishers, about how many pennants is that? Type the number.
1.7 × 40.
WHY THIS EXERCISEThe last count of the course is an expected value times a number of runners: the awards table itself.
Draw your Race Day table with its three cards. Write one sentence on each card that explains it.