Wednesday
Wednesday: Data Lab, Shuffle the Time Cards
"Lab day," Comet says, fanning out 12 index cards on the picnic table. "One lap time on each."
"Shuffle, deal six and six, find the difference," Wren says. "Fifteen times. Nova keeps the log."
The first shuffle gives -2.7. Then -1.3. Then 0.3. Comet plots each dot as it lands.
"What do you notice?" Wren asks after fifteen. "Not one shuffle reached 4."
"Zero of fifteen," Comet says. "Chance never made our gap, not once."
Nova glows. "Would you like a hint? Fifteen shuffles is a small picture. Twenty-five was better. A hundred would be best."
"So we trust the shape, not the exact zero," Wren says. "The gap is still far out on the edge."
"Then our runners really did get faster after the jog," Comet says, and writes it in the Run Log.
What you need
- 12 index cards with the crew's lap times from Monday, or your own cards from the Try it.
- Your Run Log, a pencil and graph paper for a dot plot from -6 to 6.
- A calculator or scratch paper for the means. A flat table so cards do not slide off.
Cut any extra cards with scissors on paper or cardboard, over the table.
Nothing heavy is lifted alone. Pick up any dropped card so no one slips.
Run the lab
- Check your 12 cards: 95, 92, 97, 94, 96, 90 and 88, 91, 86, 93, 90, 92. One time per card.
- Shuffle well. Deal 6 cards face up on the left and 6 on the right.
- Find each hand's mean. Subtract: left minus right. Round to 1 place and write it in your Run Log.
- Gather the cards, shuffle again, and repeat until you have 15 differences.
- Make a dot plot of your 15 differences. Mark the crew's observed 4 with a line.
- Count your shuffles at or beyond 4. Divide by 15 and compare with 5%.
The crew's lab results
The crew's 15 shuffles are made up for the Run Log. Yours will differ, and the comparison is the point.
| Shuffle | 1 | 2 | 3 | 4 | 5 | 6 | 7 | 8 |
|---|---|---|---|---|---|---|---|---|
| Difference | -2.7 | -1.3 | 0.3 | 2 | -0.3 | 1 | -1.7 | 0.7 |
| Shuffle | 9 | 10 | 11 | 12 | 13 | 14 | 15 |
|---|---|---|---|---|---|---|---|
| Difference | 3 | -2.3 | 1.3 | -0.7 | 0.3 | 2.3 | -1 |
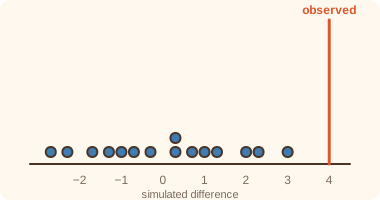
In the crew's lab, 0 of 15 shuffles reached 4. With Tuesday's 25 shuffles the count was 1. Both are under 5%.
A small number of shuffles gives a rough picture. The judgment is the same, but the crew trusts it more with more shuffles.
- Read the question.
- Tap your answer.
| Statement | True or false? |
|---|---|
| None of the crew's 15 lab shuffles reached 4. | ? |
| 15 + 25 = 40 | ? |
| Fifteen shuffles give a sharper picture of chance than a hundred. | ? |
| Shuffled differences pile up near zero because chance alone splits the groups. | ? |
Good lab work. Tomorrow a second experiment gives a gap that chance can explain, and you learn to say so.