Track Day
Track Day: The Bookshelf Table
Saturday morning, and the crew meets at the park gate with a stack of family tables to share.
"Mine is the bookshelf at home," Wren says. "Hardcover or paperback. Read or not yet. 24 books."
"Read given hardcover is 41.7%," Comet reads. "Read given paperback, 75%. What do you notice?"
"A big gap," Wren says. "Associated. The paperbacks got read. Maybe they travel better. Maybe not. The table cannot say why."
Nova shows the table with its totals. "Would you like a hint? Say the total you used for each percent out loud."
"Track Day," Comet tells a family at the gate. "Sort twenty things at home two ways at once, then compare the rows."
"What can we make?" she asks. "A table, a row-percent table and one careful sentence about association."
- A two-way table sorts every item by two questions. Inner cells are joint counts; edge totals are marginal counts.
- Joint and marginal percentages use the grand total. Conditional percentages use one row or column total.
- Compare conditional percentages across rows. A gap of 10 points or more suggests an association, which is not a cause.
- As a sample space, P(A given B) is the cell over B's total. Every count was the crew's own from Nova's log.
| Read | Not yet | Total | |
|---|---|---|---|
| Hardcover | 5 | 7 | 12 |
| Paperback | 9 | 3 | 12 |
| Total | 14 | 10 | 24 |
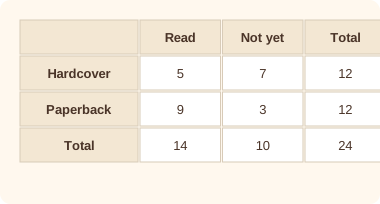
Sort the items into four piles on a grid of tape or string. Count each pile and write the totals.
Make the row-percent table. Compare the conditional percentages across the rows.
Say whether the table suggests an association, using the 10-point rule, and say what that does not prove.
Let each family member pick one card at random and name its probability from the table.
Any walking during the day is on a safe path with a grown-up aware, never on a road. Water is at hand.
The counts are the family's own, not facts about anyone else.
- Read the question.
- Tap your answer.
Among the 12 hardcover books, what percent have been read? (Round to 1 place.)Read given hardcover is 41.7% and given paperback is 75%. Does the bookshelf table suggest an association?One of the 24 books is picked at random. What is the probability it has been read?Track Day done. Next week: weeks of practice against laps run, on a scatter plot with a line of fit.