Track Day
Track Day: Your Own Dot Plot
Saturday morning, and the crew meets at the park gate with clipboards and a stopwatch.
"Track Day," Comet says. "Not a race. We each show someone one plot from this week."
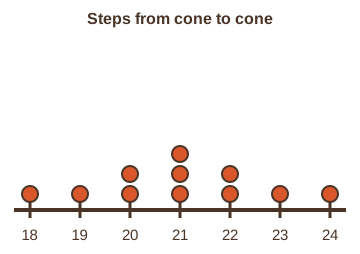
Wren counts his steps from the gate cone to the fountain cone eleven times. "18, 19, 20, 20, 21, 21, 21, 22, 22, 23, 24 steps."
"Median 21, IQR 2," he says. "Symmetric, so I would also report the mean, 21."
Nova shows the dot plot on her side. "Would you like a hint? Explain each measure in one sentence to whoever stops."
"The dots show every count," Comet tells a family at the gate. "The box shows the middle half."
"What can we make?" she asks. "Your family's own plot, from a number you collect at home today."
- Three plots on a number line: dot plot (every value), histogram (counts in bins), box plot (five-number summary).
- Center: mean (sum ÷ n) or median (middle value). Spread: standard deviation (the crew divides by n) or IQR (Q3 - Q1).
- Symmetric sets: report the mean and standard deviation. Skewed sets: report the median and IQR.
- Compare two groups by center and by spread on the same scale. Every reading was the crew's own from Nova's log.
Collect the values together and write them in order on one sheet.
Draw the dot plot. Under it, draw the box plot on the same number line.
Find the median and the IQR. If the hill looks even, find the mean too and compare it with the median.
Let each person say one sentence about the shape, the center or the spread.
The numbers are the family's own readings, not facts about anyone else.
Cutting paper for number lines is scissors only. Nothing heavy is lifted alone.
- Read the question.
- Tap your answer.
Track Day done. Next week: a lap far from the rest, the outlier rule, and the bell-shaped normal model.