Wednesday
Wednesday: Numbers Lab, Sixty Spins
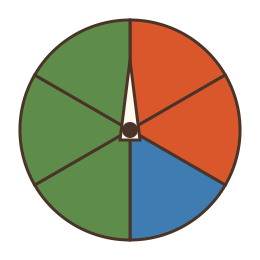
Raven sets a six-sector plate on the Numbers Desk. "Spinner B. Two red, one blue, three green."
Rocket studies it. "Green has half the plate. Red has a third. Blue has one sixth."
"Sixty spins," Nova says. "Predict first."
Rocket scribbles. "Thirty green, twenty red, ten blue."
They take turns flicking the clip. Raven tallies every stop. The marks grow into three uneven columns.
"What do you notice?" Raven asks when the sixtieth spin stops.
Rocket counts. "Thirty green, exactly! Eighteen red, twelve blue. Two off each way."
"Two off in sixty," Nova says. "Does the model fit?" Rocket nods. "It fits. Spinner B is honest."
Your investigation
Today you build a spinner, predict what it will do, spin it many times, and compare. This is a probability experiment.
Build spinner B if you can: six equal sectors, two red, one blue, three green. Any three colors or patterns work.
- A paper plate or a paper circle.
- A marker or crayons in three colors.
- A paper clip and a pencil.
- Your Numbers Notebook for the tally.
Paper clips are small parts. Keep them away from children under three and from pets.
If you need to cut the plate, a grown-up handles the scissors.
- Fold the plate in half, then in thirds, to mark six equal sectors. Draw the lines.
- Color two sectors red, one blue and three green.
- Write your prediction for 60 spins: 60 × 1/3 red, 60 × 1/6 blue, 60 × 1/2 green.
- Spin 60 times. Tally each stop in your notebook.
- Write the observed count for each color beside your prediction.
- Find each relative frequency: observed count over 60. Compare it with the probability.
The crew's sixty spins
Spinner B has 6 equal sectors: 2 red, 1 blue and 3 green.
So the probabilities are red 1/3, blue 1/6 and green 1/2. They add to 1.
In 60 spins the crew predicted 20 red, 10 blue and 30 green. Here is what happened.
| Color | Probability | Predicted in 60 | Observed | Relative frequency |
|---|---|---|---|---|
| red | 1/3 | 20 | 18 | 3/10 |
| blue | 1/6 | 10 | 12 | 1/5 |
| green | 1/2 | 30 | 30 | 1/2 |
- Read the question.
- Tap your answer.
What is the probability of landing on green on spinner B?What is the probability of landing on red on spinner B?The probability is 1/6. In 60 tries, about how many times should blue happen?| Statement | True or false? |
|---|---|
| On spinner B, green is more likely than red. | ? |
| The relative frequency of blue in the crew's spins was 1/5. | ? |
| A prediction that is two off in sixty spins means the spinner is unfair. | ? |
| Red and green together fill 5/6 of spinner B. | ? |
Did the fractions move closer to the probabilities, or farther away? More spins usually means closer.
Sixty spins takes about ten minutes. Taking turns spinning and tallying keeps it fun.
You tested a probability model with real spins. Tomorrow the crew asks how a few kids can speak for the whole street.