Tuesday
Tuesday: Predict, Then Spin
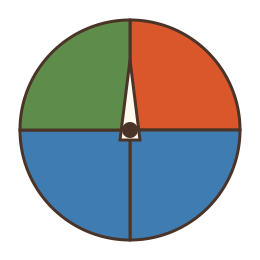
Rocket grips the paper clip pointer. "Forty spins on spinner A. I predict exactly 20 blue."
"Exactly?" Nova asks. "Or about?"
"About," Rocket says. "Half of 40 is 20. Ten red, ten green."
Raven keeps the tally. The pointer whirs. Tick marks pile up. "What do you notice?" she asks at the end.
Rocket reads the sheet. "Twenty-two blue. Nine red. Nine green. Close, but not exact."
"Probability predicts the long run," Nova says. "Not any single spin, and not an exact count."
"So 22 out of 40 is the relative frequency," Raven says. "And 1/2 is the probability. They should be close."
Rocket grins. "Close enough. Spinner A is fair."
Predicting a count
Probability tells you the share of tries you expect in the long run. Multiply the probability by the number of tries.
Blue has probability 1/2. In 40 spins, you expect about 1/2 × 40 = 20 blue.
Red has probability 1/4. Expect about 1/4 × 40 = 10 red, and about 10 green.
These are predictions, not promises. Real spins wobble around the predicted count. A few more here, a few fewer there.
Checking against real spins
Raven tallied 40 spins of spinner A. Here is the prediction beside what actually happened.
The relative frequency of an event is the times it happened divided by the total tries. It is a fraction of the spins.
Blue came up 22 times in 40 spins: a relative frequency of 22/40 = 11/20. The probability was 1/2. Close.
When the observed counts sit near the predicted counts, the model fits. When they sit far off, something about the spinner or the spinning needs a look.
| Color | Probability | Predicted in 40 spins | Observed | Relative frequency |
|---|---|---|---|---|
| red | 1/4 | 10 | 9 | 9/40 |
| blue | 1/2 | 20 | 22 | 11/20 |
| green | 1/4 | 10 | 9 | 9/40 |
Build a spinner
- Draw lines across a paper plate to split it into equal sectors. Fold it in half, then in half again, for four.
- Color each sector. Equal sectors make equally likely outcomes.
- Lay a paper clip on the plate and hold a pencil point through its end at the center.
- Flick the free end of the clip. Where it stops is the outcome.
- Tally each outcome. Compare the tally with your prediction when you finish.
- Read the question.
- Tap your answer.
The probability is 0.5. In 40 tries, about how many times should blue happen?The probability is 0.25. In 40 tries, about how many times should red happen?- Read the question.
- Tap your answer.
- ?Decide whether the model fits or needs a second look.
- ?Spin and tally the real outcomes.
- ?Multiply each probability by the number of spins to predict a count.
- ?Compare the observed counts with the predicted counts.
- ?Find the probability of each color from the sectors.
Predict, spin, compare. Tomorrow you build your own spinner and run the test yourself.