Friday
Friday: Planning the Data Fair
Rocket pins a blank poster to the wall above the Numbers Desk. "Tomorrow is the Data Fair. I have nothing on my poster."
"You have twelve weeks," Raven says. "What do you notice when you list what we learned?"
Rocket counts on his fingers. "A statistical question. A survey. A plot. A center and a spread. A fair spinner."
Nova projects a checklist. "That is your poster. One section each."
"And a report," Raven adds. "Count, units, shape, center, spread, and what it all means."
Rocket uncaps his marker. "Statistical question first. How many minutes of games would kids on our street play?"
"Then the spinner game you will run at Field Day," Nova says. "Fair, with its probabilities written down."
Rocket writes the title. "Data Fair, by the Numbers Desk crew."
What a Data Fair poster holds
Tomorrow you run your own Data Fair at home. Today you plan it. Here are the six parts, in order.
- A statistical question that names a group and a measure, about things like games, minutes, steps or tosses.
- A plan to collect data from five or more family members or friends your family knows. Numbers only, never names.
- A display of the data: a dot plot, a histogram or a box plot.
- A report of the center and the spread, with the measures that fit the shape.
- A fair spinner game with each outcome's probability written as a fraction.
- A test of the spinner: predicted counts, observed counts and whether the model fits.
A sample poster from the crew
Question: how many Field Day games would kids on our street play? Group: the kids on our street. Measure: games.
Data: 16 kids drawn at random from 48. Display: a dot plot. Shape: a peak at 4 with a cluster from 3 to 6.
Center: median 4, because two far out answers at 8 would drag the mean. Spread: IQR 2.
Game: spinner A, land on blue to win. Probability of blue 1/2. Test: 40 spins, predicted 20 blue, observed 22. The model fits.
Each part is one sentence or one small picture. A poster is a report you can read from across the room.
| Poster part | The crew's version |
|---|---|
| Statistical question | How many Field Day games would kids on our street play? |
| Data | 16 answers from a random sample of 48 kids: 2, 3, 3, 3, 4, 4, 4, 4, 4, 5, 5, 5, 6, 6, 8, 8 |
| Display | Dot plot |
| Center and spread | Median 4, IQR 2 |
| Spinner game | Spinner A, blue wins, probability 1/2 |
| Spinner test | 40 spins: predicted 20 blue, observed 22 |
- ?Write the statistical question.
- ?Collect the data, numbers only.
- ?Display the data on a number line.
- ?Report the center and the spread.
- ?Build a fair spinner and write its probabilities.
- ?Test the spinner and compare with the prediction.
- Read the question.
- Tap your answer.
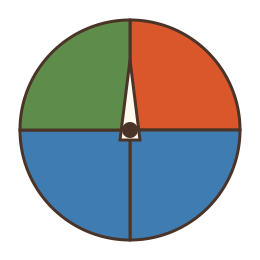 What is the probability of blue on the crew's game spinner?
| Statement | True or false? |
|---|---|
| A statistical question expects different answers from different people. | ? |
| The mean is the middle value when the data is in order. | ? |
| The MAD is the average distance of the values from the mean. | ? |
| A probability of 1 means the event is impossible. | ? |
| A random sample gives every member of the population the same chance of being picked. | ? |
| A fair spinner game gives every player the same probability of winning. | ? |
Gather a paper plate, a paper clip, graph paper, a marker and your Numbers Notebook for tomorrow.
Your plan is ready. Tomorrow is the Data Fair: your question, your data, your spinner and your report.