Data Day
Data Day: The Data Fair
The kitchen table is covered. Rocket's poster leans against the wall. Raven's dot plot sits beside a paper plate spinner.
"Data Fair is open," Rocket announces. "Question, data, plot, center, spread, spinner."
Raven reads the poster aloud to Nova. "Sixteen kids. Median 4 games. IQR 2. Blue wins half the time."
"What do you notice about how it all fits together?" Raven asks.
"Every piece needed the one before it," Rocket says. "No question, no data. No data, no plot."
Nova hovers over the spinner. "And no prediction, no test."
Rocket flicks the clip one more time. It stops on blue. "Half the time," he says. "Just like the model."
"Now it is your turn," Nova says, turning to face the room. "Run your own fair."
- A statistical question expects many answers, so you collect data.
- Dot plots, histograms and box plots show the shape of the data.
- The mean or the median gives the center. The range, IQR or MAD gives the spread.
- Probability runs from 0 to 1 and predicts the long-run share of tries.
- A random sample can speak for a population. A fair game gives every player the same chance.
Put the answers in order and draw a dot plot on graph paper. Describe the shape.
Find the center that fits the shape (mean or median) and a spread (range, IQR or MAD).
Build your fair spinner. Write each outcome's probability. Predict 40 spins, then spin 40 times and tally.
Present your poster to your family: question, data, plot, center, spread, spinner and test.
Small parts stay away from children under three and from pets.
If you survey neighbors, a grown-up goes to the door with you. Only people your family knows take part.
The survey never records names or ages. Anyone may skip it. Five answers is enough.
Please be the audience for the poster. Ask one question about the shape and one about the spinner test.
The crew's poster, checked
The crew's spinner game uses spinner A: blue wins with probability 1/2. In 40 spins they predicted 20 and observed 22.
Their survey of 16 kids had a median of 4 games and an IQR of 2. The median fit the shape because of two far out answers.
Check your own poster against the same list. Every part should be there, and every number should come from your data.
- Read the question.
- Tap your answer.
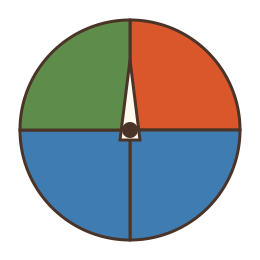 What is the probability of red on the crew's game spinner?
| Statement | True or false? |
|---|---|
| A Data Fair survey records numbers, not names. | ? |
| A dot plot shows every answer as one dot. | ? |
| If the observed count misses the prediction by three, the spinner must be unfair. | ? |
| The probabilities of all the outcomes on a spinner add to 1. | ? |
You ran a Data Fair from question to test. That is the whole course in one afternoon. Well done, crew.