Thursday
Thursday: Comparing Two Groups
Raven lays two score sheets side by side on the Numbers Desk. "Sack hop times. Younger kids on the left, older kids on the right."
Rocket scans them. "The older kids are faster. Obviously. Let me build them a longer course."
"How much faster?" Nova asks. "And is the difference big compared with how spread out each group is?"
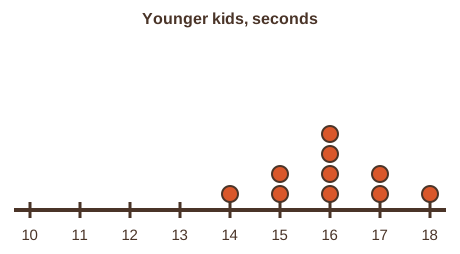
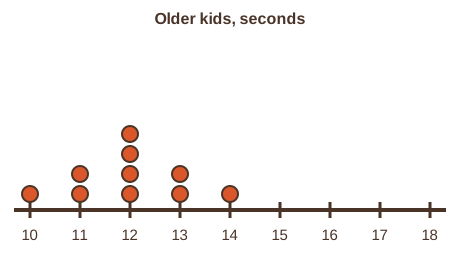
Rocket stacks two dot plots on the same number line. "The groups barely touch. Older kids sit around 12, younger around 16."
"What do you notice about the spread?" Raven asks.
"Both groups are tight," Rocket says. "Each one is about a second wide."
"Then a four second gap between the centers is huge," Raven says. "Five times the spread."
Nova brightens. "Now that is a fair comparison."
Two groups, one number line
At practice, 10 younger kids and 10 older kids each hopped the sack course once. Raven timed them in whole seconds.
To compare two groups, draw both on the same number line. Then compare the centers, and compare the spreads.
| Group | Times in seconds, in order |
|---|---|
| Younger kids | 14, 15, 15, 16, 16, 16, 16, 17, 17, 18 |
| Older kids | 10, 11, 11, 12, 12, 12, 12, 13, 13, 14 |
Centers and spreads
Younger kids: the times add to 160, so the mean is 16. The median is 16. The MAD is 0.8.
Older kids: the times add to 120, so the mean is 12. The median is 12. The MAD is 0.8.
The difference between the means is 16 - 12 = 4 seconds.
Each group has a MAD of 0.8. A difference of 4 is 4 ÷ 0.8 = 5 MADs.
When the gap between centers is many MADs wide, the two groups hardly overlap. The difference is real, not just noise.
If the gap were less than one MAD, the dot plots would overlap a lot. Then you could not say one group is clearly faster.
| Younger kids | Older kids | |
|---|---|---|
| Count | 10 | 10 |
| Mean | 16 | 12 |
| Median | 16 | 12 |
| Range | 4 | 4 |
| MAD | 0.8 | 0.8 |
- Read the question.
- Tap your answer.
What is the mean time of the younger kids, in seconds?- Read the question.
- Tap your answer.
| Statement | True or false? |
|---|---|
| Both groups have 10 kids. | ? |
| The younger kids' mean time is 16 seconds. | ? |
| A gap of five MADs between centers means the groups overlap a lot. | ? |
| The two groups have the same MAD. | ? |
| If the gap were less than one MAD, you could still say one group is clearly faster. | ? |
Then say what would change if both groups had a MAD of 4 instead.
You compared two groups fairly, using their spread as the ruler. Tomorrow you decide which measures fit which shapes.