Friday
Friday: Which Measure Fits?
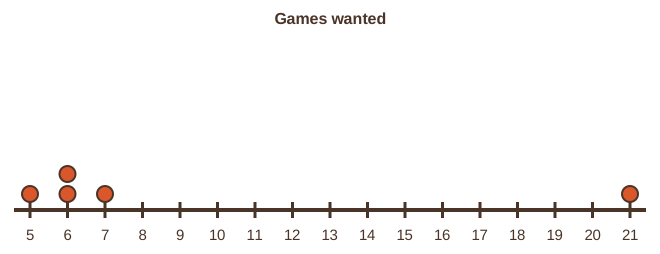
Rocket frowns at a tiny survey on the Numbers Desk. "Five kids. Games wanted: 5, 6, 6, 7 and 21. The mean is 9!"
"Twenty-one?" Raven says. "What do you notice about that answer?"
"It is way out by itself," Rocket says. "One kid who wants to play all day."
Nova hovers over the dot plot. "Where does the mean land? Where does the median land?"
Rocket checks. "The mean is 9, where nobody is. The median is 6, right in the cluster."
"So which number tells the truth about these five kids?" Raven asks.
"The median," Rocket says. "The 21 dragged the mean away from everyone."
Nova dims. "Shape first. Then choose your measure."
Far out values pull the mean
The mean uses every value, so one far out value can drag it a long way. The median only cares about order, so it barely moves.
For 5, 6, 6, 7, 21 the mean is 45 ÷ 5 = 9. The median is 6.
Change the 21 to a 7 and the mean drops to 6.2. The median stays at 6. The median resists far out values.
When a data set is balanced, with no far out values, the mean and the median agree. Then either one describes the center well.
When a data set is lopsided, or has a far out value, the median usually describes the typical value better.
| Shape of the data | Center to report | Spread to report |
|---|---|---|
| Balanced, no far out values | Mean (or median; they agree) | MAD |
| Lopsided or has a far out value | Median | IQR |
| You want the quickest rough idea | Either | Range |
The spread pairs with the center. The MAD measures distance from the mean, so report it with the mean.
The IQR is built from the median and the quartiles, so report it with the median. Far out values do not change the IQR much either.
Whichever you choose, say why. A good data report names the shape and then the measures that fit it.
- Read the question.
- Tap your answer.
What is the mean of 5, 6, 6, 7, 21?What is the median of 5, 6, 6, 7, 21?Center and spread in everyday life
Whenever someone gives you one number for a group, ask which center it is. Then ask about the spread.
A typical hop time of 12 seconds means more when you know the MAD was 0.8. It means something different if the MAD was 5.
This week you learned to report a data set the full way: count, units, shape, center and spread. That is a complete picture.
- Read the question.
- Tap your answer.
| Statement | True or false? |
|---|---|
| One far out value can move the mean a lot. | ? |
| One far out value moves the median a lot. | ? |
| The median of 5, 6, 6, 7, 21 is 6. | ? |
| The MAD is the average distance of the values from the mean. | ? |
| The IQR is the greatest value minus the least. | ? |
| A measure of center sums up a data set with one number. | ? |
- ?Say what the numbers mean in the real situation.
- ?Choose the center that fits the shape and report it.
- ?Say how many values you collected and what units you measured in.
- ?Draw the data and describe its shape.
- ?Choose the spread that pairs with that center and report it.
Week 11 is done. Next week: probability, fair spinners, and the Data Fair itself.