Wednesday
Wednesday: Numbers Lab, Handfuls
Rocket plunges his hand into the bean jar. "I bet I grab exactly 20 beans every time."
"Every time?" Raven asks. "That sounds like a question with many answers."
Rocket counts his handful onto the tray. "Eighteen. Hmm. One more try." He grabs again. "Twenty-one."
Nova hovers above the tray. "How many handfuls would make a fair picture?"
"Ten," Rocket decides. "Ten grabs, ten counts, one dot plot."
Raven writes the counts as he goes. "What do you notice so far?"
"They are all close to 20," Rocket says. "But almost never exactly 20."
"Close but varied," Nova says. "That is a distribution. Let us see its shape."
Your investigation
Today you collect your own data set and draw its shape. The question is statistical: how many beans fit in one of your handfuls?
Each grab gives a different count. Ten grabs give you a distribution.
Before you start, make a prediction. Write one number you think will come up most often. You will check it at the end.
- A jar or bowl of small counters: dried beans, buttons or paper squares.
- A tray or a baking sheet to count on.
- Your Numbers Notebook and a pencil.
- Graph paper for the dot plot.
Nothing goes in your mouth. Wash your hands after you finish.
Count over the tray so beans do not roll onto the floor. Pick up any that fall so no one slips.
- Reach in and grab one handful without looking. Pour it onto the tray.
- Count the beans and write the number in your notebook.
- Put the beans back and repeat until you have ten counts.
- Draw a number line from your least count to your greatest count.
- Stack one dot above each count. Look for the peak, any gaps and the cluster.
- Compare the plot with your prediction. Was your number the peak?
Rocket's ten handfuls
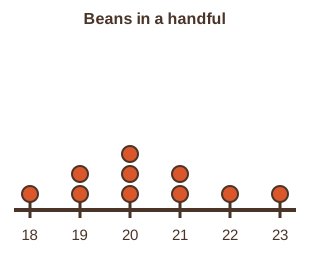
Rocket predicted 20 every time. Here is what really happened. Read the table, then the plot.
His counts reach from 18 to 23. The tallest stack is at 20, so his prediction was close to the peak.
But only three grabs hit 20 exactly. The other seven missed by one, two or three beans. That spread is normal.
| Grab | Beans |
|---|---|
| 1 | 18 |
| 2 | 21 |
| 3 | 19 |
| 4 | 22 |
| 5 | 20 |
| 6 | 19 |
| 7 | 23 |
| 8 | 20 |
| 9 | 20 |
| 10 | 21 |
- Read the question.
- Tap your answer.
Which bean count came up most often in Rocket's ten grabs?How many of Rocket's grabs had 20 beans or more?How wide is the plot, from the least count to the greatest?Prediction and data
Rocket's prediction was a single number. His data was ten numbers with a shape. Both are useful, but they are not the same thing.
A prediction is what you expect before you look. Data is what you find when you look. Good scientists write both down.
Rocket's peak landed on his prediction, 20. But his counts spread 5 beans wide. A handful is never exactly the same twice.
When your own plot is done, compare it with your prediction the same way. Was your number the peak, near the peak, or far off?
| Statement | True or false? |
|---|---|
| Ten handfuls of beans will almost always give ten different counts. | ? |
| Rocket's counts spread from 18 to 23. | ? |
| A prediction is what you expect before you collect the data. | ? |
| If your prediction misses the peak, your data is wrong. | ? |
Do the two plots have the same peak? Which hand spreads wider?
If beans are not handy, buttons, paper clips or torn paper squares work the same way.
Your first home-made distribution. Tomorrow the crew opens the real Field Day survey.