Tuesday
Tuesday: Dot Plots and Histograms
Raven spreads a page of times across the Numbers Desk. "Twenty practice runs on the sack hop course, in seconds."
Rocket scans the list. "Numbers everywhere. I cannot see anything in this."
"That is why we draw it," Raven says. "What do you notice when the dots line up?"
Nova projects a number line onto the table. "One dot per run. Place them."
Rocket stacks the dots, and a hill appears. "Most runs took 10 to 13 seconds. Nobody took 8."
"Now group them in twos," Nova says. "8 and 9 together, 10 and 11 together."
Rocket draws bars over each group. "Same hill, fatter bars. It is the same data in a new coat."
"Two pictures, one shape," Raven says. "Let us learn to read both."
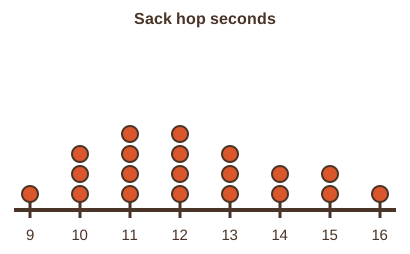
A dot plot: one dot per value
| Run 1 to 10 | Run 11 to 20 |
|---|---|
| 9, 10, 10, 10, 11, 11, 11, 11, 12, 12 | 12, 12, 13, 13, 13, 14, 14, 15, 15, 16 |
The table holds the 20 practice times from Raven's log, already in order from fastest to slowest.
To draw a dot plot, draw a number line from the least value to the greatest. Then put one dot above each value, stacking repeats.
The stacks show the shape. A tall stack is a peak. A stretch with no dots is a gap. A bunch of tall stacks together is a cluster.
This plot has a cluster from 10 to 13. The stacks at 11 and 12 are tied for tallest, with 4 dots each.
The dots thin out toward 16. The slowest run, 16 seconds, stands alone at the right end.
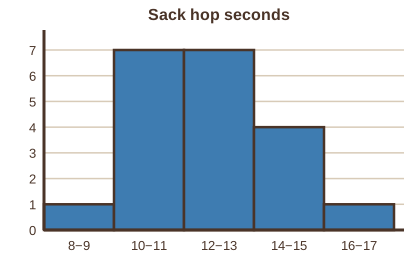
A histogram: bars over equal groups
A histogram groups the values into equal-width bins. Each bar shows how many values fall in that bin.
The crew used bins two seconds wide: 8 to 9, 10 to 11, 12 to 13, and so on.
Every value lands in exactly one bin. The bars touch, because the bins share their edges along the number line.
A histogram hides the single values but shows the shape fast. Use it when the data set is large.
The bin width is your choice. Wider bins make fewer, taller bars. Narrower bins show more detail.
| Bin (seconds) | Runs |
|---|---|
| 8 to 9 | 1 |
| 10 to 11 | 7 |
| 12 to 13 | 7 |
| 14 to 15 | 4 |
| 16 to 17 | 1 |
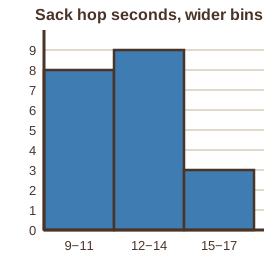
Here is the same data with bins three seconds wide: 9 to 11, 12 to 14 and 15 to 17.
The hill is still there, but it is chunkier. The bins changed. The data did not.
- Write the values in order from least to greatest.
- Draw a number line that reaches from the least value to the greatest.
- Dot plot: stack one dot above each value.
- Histogram: pick a bin width, count the values in each bin, and draw a bar for each count.
- Label the line and give the picture a title.
- Read the question.
- Tap your answer.
How many runs took exactly 12 seconds?How many runs took 14 seconds or more?What was the fastest time, in seconds?- Read the question.
- Tap your answer.
How many runs fall in the 10 to 11 second bin?How many runs are in the two tallest bins together?Add every bar. How many runs in all?In the wider histogram, how many runs are in the 9 to 11 bin?- ?Add a title and a label.
- ?Stack one dot above each value.
- ?Draw a number line from least to greatest.
- ?Put the values in order.
| Statement | True or false? |
|---|---|
| A histogram shows every single value as its own dot. | ? |
| Changing the bin width changes the bars but not the data. | ? |
| The bars of a histogram add up to the number of values. | ? |
| The sack hop dot plot has a gap at 8 seconds. | ? |
Then draw the three-second histogram. Check your bars against the one Nova drew.
Two pictures, one shape. Tomorrow the Numbers Lab collects its own data, one handful at a time.