Thursday
Thursday: The Field Day Survey
Raven drops a stack of tally sheets on the Numbers Desk. "Twenty kids answered. How many Field Day games would you play?"
Rocket flips through them. "Someone said 8! And someone said 2. Those cannot both be right."
"They are both data," Raven says. "What do you notice about where most of the answers land?"
Nova draws a number line in the air. "Place them before you decide."
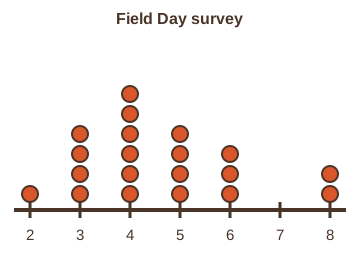
Rocket stacks the dots. A peak rises at 4. "Most kids said 4. Then 3 and 5. Nobody said 7."
"A peak at 4, a gap at 7, two kids far out at 8," Raven says. "That is the shape."
Rocket taps the peak. "So I build about 4 games, with a bonus round for the 8 kids?"
Nova blinks. "Now you are reading data."
The crew's survey data
Raven asked 20 kids on the street. A grown-up stood with her at each door. She wrote down only the number, never who said it.
Here are the answers in order from least to greatest, and then as a count for each answer.
| Kid 1 to 10 | Kid 11 to 20 |
|---|---|
| 2, 3, 3, 3, 3, 4, 4, 4, 4, 4 | 4, 5, 5, 5, 5, 6, 6, 6, 8, 8 |
| Answer (games) | How many kids said it |
|---|---|
| 2 | 1 |
| 3 | 4 |
| 4 | 6 |
| 5 | 4 |
| 6 | 3 |
| 8 | 2 |
Describe the shape
- Peak: the tallest stack is at 4 games, with 6 kids.
- Cluster: most dots sit between 3 and 6. That is where the typical answers live.
- Gap: no kid said 7.
- Far out: two answers sit at 8, away from the cluster. Values like that are worth a second look.
Reporting a data set means saying three things. How many answers you collected, what you measured, and what shape you saw.
Here: 20 kids, and the games they would play. The peak is at 4, with a cluster from 3 to 6 and two far out at 8.
Say it that way and anyone can picture the data without seeing the plot. That is the goal of a report.
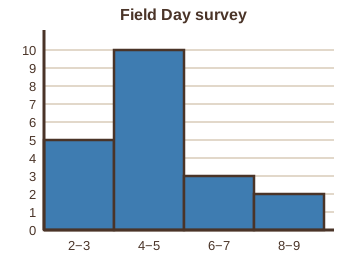
The histogram below groups the answers in bins two games wide. The 4 to 5 bar towers over the rest.
- Read the question.
- Tap your answer.
How many kids said 5 games or more?How many kids said fewer than 4 games?How many kids are in the 4 to 5 bar of the histogram?- Read the question.
- Tap your answer.
Then say what you would tell Rocket to build. Use the data, not a guess.
You described a real distribution with real shape words. Tomorrow you meet the box plot and review the week.