Monday
Monday: A Question With Many Answers
Rocket slaps a clipboard onto the Numbers Desk. "Field Day is three weeks away. I need to know how many games to build."
"So ask the kids on our street," Raven says. "How many games would you play?"
Rocket grabs a marker. "Easy. Everyone will say five. Five games. Done."
Nova hovers over the clipboard, her light blinking. "Will everyone give the same answer?"
Rocket pauses. "Well, no. Some kids get tired. Some want to play all day."
"Then one answer is not enough," Raven says. "We need all of them. What do you notice about that?"
Rocket grins. "It is a question with many answers. That means we need data."
Nova dims her light. "And data needs a picture. Start collecting."

Statistical questions
Some questions have one answer. "How many legs does a chair have?" You can look at the chair and know.
A statistical question is different. It expects different answers from different people or different measurements.
"How many Field Day games would the kids on our street play?" Some kids will say 3. Some will say 7.
Because the answers vary, you collect them all. That collection is your data. Then you look at the whole set at once.
A good statistical question says who you will ask and what you will count. "How many minutes do kids on our street read each night?"
It names the group (kids on our street) and the measure (minutes of reading). Both parts matter when you report the answer.
| Question | Statistical? | Why |
|---|---|---|
| How many games would YOU play? | No | One person, one answer |
| How many games would the kids on our street play? | Yes | Many kids, many answers |
| How long is this sack course? | No | Measure once and you know |
| How many seconds do kids take to hop the sack course? | Yes | Each kid takes a different time |
| How many steps is it from our door to the mailbox? | No | Count once and you know |
| How many steps do family members take on a school day? | Yes | Each person walks a different amount |
The crew's test survey
Raven tried the question on 12 kids first, to practice. She wrote each answer on the tally sheet, never the kid's name.
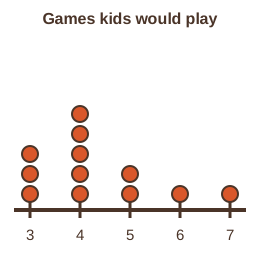
Nova turned the list into a dot plot. Each dot is one kid. A dot sits above the number that kid said.
Look at the plot. The dots pile up in the middle and thin out at the ends. That pile is the shape of the data.
The tallest stack is at 4. The answers reach from 3 to 7. Nobody said 8 or more.
| Kid 1 to 6 | Kid 7 to 12 |
|---|---|
| 3, 4, 4, 5, 3, 6 | 4, 5, 4, 3, 7, 4 |
- Read the question.
- Tap your answer.
- Read the question.
- Tap your answer.
How many kids answered the test survey? Count the dots.Which number of games has the tallest stack of dots?How many kids said 4 games?How many kids said 5 or more games?| Statement | True or false? |
|---|---|
| A statistical question expects different answers from different people. | ? |
| "How tall is this door?" is a statistical question. | ? |
| On a dot plot, each dot stands for one answer. | ? |
| The crew's test survey has 14 answers. | ? |
| A good statistical question names the group and the measure. | ? |
Say out loud why the second one needs data. Keep both in your Numbers Notebook.
Good start. Tomorrow you learn two ways to draw a data set: the dot plot and the histogram.