Wednesday
Wednesday: Boathouse Lab, Twenty Draws
"Draw two, count the reds, put them back, shake," Comet says. "Twenty times. Wren keeps the tally."
She draws. Red, blue. "One red." Again. Red, red. "Two." Again. Gold, blue. "Zero."
After twenty rounds Wren reads the tally. "Zero reds 5 times, one red 11 times, two reds 4 times."
"What do you notice?" he asks. "One red is the common case."
Nova projects three bars. "Would you like a hint? Work out what the bag predicts, then compare."
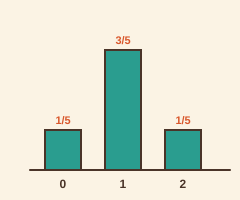
"Zero reds is 1/5, one red is 3/5, two reds is 1/5," Comet says. "Out of twenty, that predicts 4, 12 and 4."
"We got 5, 11, 4," Wren says. "Close. Twenty draws is not forever, and the bag does not owe us anything."
What you need
- A cloth bag or a cup and 6 tokens or paper scraps: 3 marked R, 2 marked B, 1 marked G.
- Your Boathouse Log and a pencil.
- A partner to keep the tally, and a grown-up nearby.
Nothing goes in the mouth. The lab stays at the table.
On Regatta Day the crew wears life vests on or near the water, and a grown-up is on the dock.
Nothing heavy is lifted alone.
A random variable
A random variable gives each outcome a number. Here X is the number of red tokens in two draws: 0, 1 or 2.
Its probability distribution lists each value with its probability. The probabilities add to 1.
P(X = 0): no reds, 3/6 × 2/5 = 1/5. P(X = 2): two reds, 3/6 × 2/5 = 1/5.
P(X = 1): red then other, or other then red. 3/6 × 3/5 twice, which is 3/5.
Check: 1/5 + 3/5 + 1/5 = 1. Every outcome is counted once.
Run the lab
- Put 6 tokens in the bag: 3 R, 2 B, 1 G. Shake it.
- Draw two tokens without putting the first back. Count the reds: 0, 1 or 2. Tally it.
- Put both tokens back and shake. Repeat until you have 20 rounds.
- Turn each tally into a fraction of 20. That is your empirical distribution.
- Write the theoretical distribution beside it: 1/5, 3/5, 1/5. Compare bar by bar.
- Find the mean of your 20 counts. Compare it with the expected value below.
The crew's lab log
Here is the crew's own tally from twenty rounds. Yours will differ, and that is the point of a lab.
| Reds in two draws | Tally (of 20) | Empirical probability | Theoretical probability |
|---|---|---|---|
| 0 | 5 | 1/4 | 1/5 |
| 1 | 11 | 11/20 | 3/5 |
| 2 | 4 | 1/5 | 1/5 |
The theoretical expected value is 0 × 1/5 + 1 × 3/5 + 2 × 1/5 = 1. Over many rounds, the mean count of reds settles near 1.
The crew's empirical expected value is 0 × 1/4 + 1 × 11/20 + 2 × 1/5 = 0.95. Twenty rounds landed close to 1, not on it.
Expected value is the mean of the distribution. It need not be a value you can draw: a mean of 0.95 reds is fine.
- Read the question.
- Tap your answer.
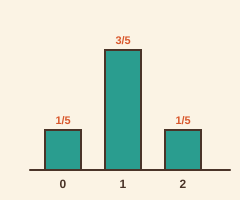 Two draws give 0 reds with probability 1/5, 1 red with probability 3/5, 2 reds with probability 1/5. What is the expected number of reds?
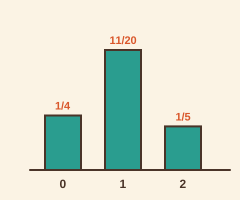 The crew's tally gives 0 reds with probability 1/4, 1 red with probability 11/20, 2 reds with probability 1/5. What is the empirical expected value?
| What the lab shows | True or false? |
|---|---|
| The probabilities of a distribution add to 1. | ? |
| 5 + 11 + 4 = 20 | ? |
| An expected value must be a value you can actually draw. | ? |
| The empirical distribution comes from the tally; the theoretical one comes from the bag's counts. | ? |
Careful lab work. Tomorrow expected value weighs the points table, and two race strategies are compared.