Tuesday
Tuesday: Tables, Pairs and Graphs
Rocket pushes the card cart down the driveway while Raven counts seconds. "Four meters every second," she reads from the tape.
"So distance depends on time," Rocket says. "Time is the input. Distance is the output."
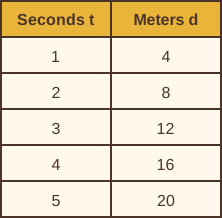
Raven writes a table: 1 second, 4 meters. 2 seconds, 8 meters. 3 seconds, 12 meters.
"What do you notice if we plot those as points?" she asks.
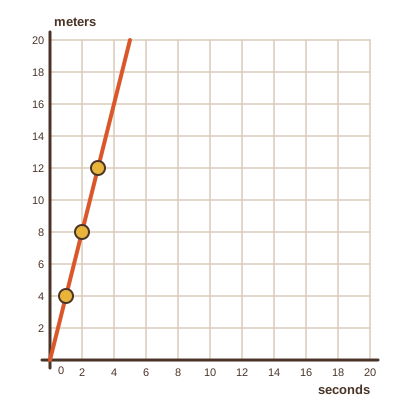
Rocket plots (1, 4), (2, 8) and (3, 12) on graph paper. "A straight line! Right through zero."
Nova hovers over the paper, her light tracing the line. "Four views of one rule," she says. "Words, a table, pairs and a graph."
"And an equation," Rocket adds. "d = 4t." Nova hums. "Five views, then."
From a rule to a table
The cart rolls 4 meters every second. Time t is independent, because the crew chooses how long to time it.
Distance d is dependent, because it follows from t. The equation is d = 4t: multiply the time by 4.
A table lists inputs and outputs side by side. Each row is an ordered pair, written (t, d) with the input first.
From pairs to a graph
Plot each ordered pair with the input across and the output up. The graph of a function is the set of all its ordered pairs.
For d = 4t the points line up on a straight line through (0, 0). Zero seconds means zero meters.
You can read the rule back from a table. Each step of 1 in t adds 4 to d, and t = 0 gives d = 0, so d = 4t.
- Decide which quantity you choose (independent) and which one follows (dependent).
- Make a table: inputs in the first column, outputs in the second.
- Write each row as an ordered pair, input first.
- Plot the pairs, input across and output up. Look for the pattern.
- Write the rule as an equation, and check it against two rows of the table.
- Read the question.
- Tap your answer.
- Read the question.
- Tap your answer.
- Read the question.
- Tap your answer.
| Statement | True or false? |
|---|---|
| In d = 4t, the time t is the independent variable. | ? |
| An ordered pair lists the output first. | ? |
| The graph of a function is the set of its ordered pairs. | ? |
| The point (2, 8) is on the graph of d = 4t. | ? |
Tables, pairs and graphs, all from one rule. Tomorrow is Puzzle Lab: you build the machine and guess the rule.