Monday
Monday: Dots on a Grid
The Loft is a mess of index cards. Comet sorts them into a pile. "Every launch we logged: pumps and top height."
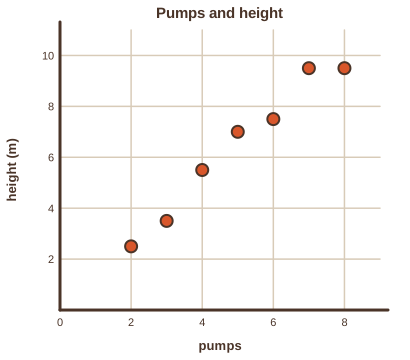
"Seven launches, seven pairs," Wren says. "Plot each one as a dot. Pumps across, height up. What do you notice?"
Comet plots them. "They climb to the right. More pumps, higher flight. Not a perfect line, but close."
"That is a scatter plot," Wren says. "The pattern is the point, not any single dot."
Nova projects a straight line through the cloud of dots. "Would you like a hint? Try to make the gaps above and below balance."
"A line of best fit," Comet says, sliding her ruler. "Now I can guess the height for ten pumps."
"Predict," Wren says. "Guess is for people without data."

Two measurements per trial
A scatter plot puts one dot for each trial. The dot's position shows two measurements at once: here, pumps and top height.
The heights are the crew's own estimates from their model and their stopwatch, made up for the Loft. The method is what matters.
Read a scatter plot by asking three things. Which way do the dots go? How tight is the pattern? Is it straight or bent?
| Launch | 1 | 2 | 3 | 4 | 5 | 6 | 7 |
|---|---|---|---|---|---|---|---|
| Pumps | 2 | 3 | 4 | 5 | 6 | 7 | 8 |
| Top height (m) | 2.5 | 3.5 | 5.5 | 7 | 7.5 | 9.5 | 9.5 |
A line by eye
- Lay a ruler across the dots so about as many sit above the line as below it.
- Make the gaps on each side roughly balance. Do not force the line through the first or last dot.
- Draw the line and read two points on it to find its slope and intercept.
- Use the line to predict a value you did not measure.
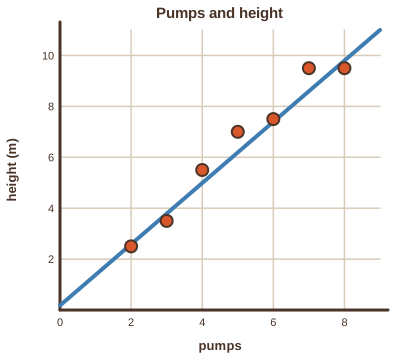
Nova's line is the least-squares line, y = 1.25x + 0.18. Tomorrow you learn what least squares means.
Your line by eye should be close to it. Both predict about 12.7 m for 10 pumps.
- Read the question.
- Tap your answer.
| Statement | True or false? |
|---|---|
| A scatter plot has one dot for each trial. | ? |
| A line of best fit must pass through every dot. | ? |
| In the pumps plot, more pumps go with greater height. | ? |
| The line predicts a height for 10 pumps even though no 10-pump launch was logged. | ? |
| The crew's heights are real measurements of real rockets. | ? |
Tape it down and read two points on it. Write the slope you get.
Strong start. Tomorrow you learn how the least-squares line is chosen and what its slope and intercept mean.