Wednesday
Wednesday: Loft Lab, Plot the Arc
The backyard is quiet at dusk. A grown-up stands by the launcher. Nova projects a fresh grid on the garage wall.
"Lab day," Comet says. "We launch, we time, and then we plot the model every half second."
Wren reads the stopwatch after the launch. "Four seconds again. So our model still holds for six pumps."
They fill a table: t from 0 to 4 in steps of 0.5, h from the rule. Comet plots each point on graph paper.
"What do you notice about the gaps between heights?" Wren asks.
"Big steps at first, tiny steps near the top, then big again," Comet says. "The curve flattens at the vertex."
Nova dims to a hint. "Would you like to mark the pairs that match?"
What you need
- The bottle rocket, launcher tubing, bicycle pump and water from last week.
- A stopwatch, graph paper, a ruler, a pencil and your Loft Log.
- A grown-up and an open outdoor space.
Everyone stands back behind the launch line. The rocket points up and away from people, windows and roads.
Never look down into a pressurized bottle. Wear glasses or goggles if you have them.
Launch only in open space, never near power lines, and wipe up water so no one slips.
Run the lab
- Launch at 6 pumps with the grown-up's go. Time from liftoff to landing and record T.
- Write your model h = 5t(T - t). Expand it to -5t² + 5Tt.
- Make a table of t from 0 to T in steps of half a second, with h for each.
- Plot the points on graph paper, seconds across and meters up. Join them in a smooth curve.
- Draw the axis of symmetry at t = T ÷ 2 and label the vertex.
- Find two pairs of times with the same height and mark them.
The crew's table for T = 4
The crew's heights come from their own model, not from a measurement of the sky. Your T sets your own table.
| t (s) | 0 | 0.5 | 1 | 1.5 | 2 | 2.5 | 3 | 3.5 | 4 |
|---|---|---|---|---|---|---|---|---|---|
| h (m) | 0 | 8.75 | 15 | 18.75 | 20 | 18.75 | 15 | 8.75 | 0 |
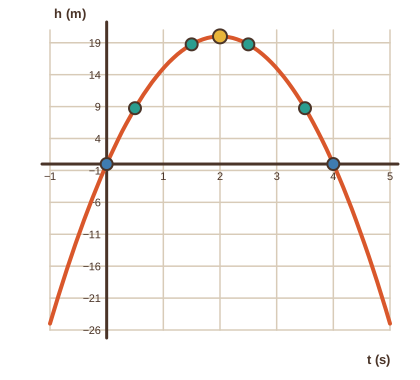
From t = 0 to 0.5 the height rises 8.75 m. From 1.5 to 2 it rises only 1.25 m.
The curve is steep near the ground and flat near the vertex. That is what a parabola looks like up close.
- Read the question.
- Tap your answer.
| Statement | True or false? |
|---|---|
| The parabola is steepest near the ground and flattest near the vertex. | ? |
| -5 × 0.5 × 0.5 + 20 × 0.5 = 8.75 | ? |
| -5 × 2.5 × 2.5 + 20 × 2.5 = 18.75 | ? |
| The average rate of change from t = 1 to t = 2 is larger than from t = 0 to t = 1. | ? |
| The crew's table comes from their model, not from measuring the sky. | ? |
Great lab work. Tomorrow the crew changes the launch and watches the graph shift, stretch and flip.