Wednesday
Wednesday: Data Lab, Twenty Samples
"One sample said 60%," Comet says. "Would another sample agree?"
"Let us find out," Wren says. "40 tokens, draw 10, count the yes cards, put them back. Twenty times."
Comet draws. Nova checks each token against the full list of 40 answers. "4 yes." Again. "5." Again. "6."
Twenty samples later Wren reads the row. "Lowest 4, highest 8. Most around 5 or 6. What do you notice?"
"They scatter," Comet says. "But they pile up near 5.6. That is 56%, close to the true 55%."
Nova projects the dot plot of twenty yes counts. "Would you like a hint? One sample is one dot."
"So a statistic wobbles from sample to sample," Wren says. "But it wobbles around the parameter."
What you need
- A cloth bag or cup with 40 tokens or paper scraps numbered 1 to 40.
- A list of 40 made-up yes-or-no answers, one per number. Decide them with a coin before you start.
- Graph paper, a pencil and your Run Log. A partner to record, and a grown-up who knows where you are.
Cut paper scraps with scissors on paper. Nothing heavy is lifted alone.
Any walking or jogging this week is on the park loop or a safe path, never a road. A grown-up is aware and water is at hand.
Run the lab
- Make your population: for each number 1 to 40, flip a coin and write yes for heads, no for tails.
- Count the yes answers in the whole list. That percent is your parameter. Write it down and cover it.
- Shake the bag and draw 10 tokens. Look up each number's answer and count the yes answers.
- Record the yes count, put the tokens back, and shake. Repeat until you have 20 samples.
- Make a dot plot of your 20 yes counts. Mark your parameter as a count out of 10.
- Compare: where do the dots pile up? How far does the farthest dot sit from the parameter?
The crew's lab log
Here are the crew's own twenty samples from Nova's Run Log. Yours will differ, and that is the point.
| Samples 1 to 10 | Samples 11 to 20 |
|---|---|
| 4, 5, 6, 5, 7, 6, 5, 4, 6, 8 | 5, 6, 7, 5, 6, 4, 5, 7, 6, 5 |
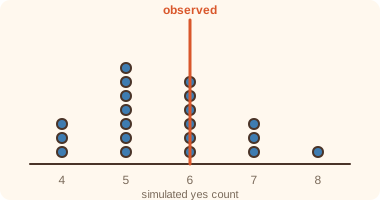
The twenty yes counts add to 112, so their mean is 5.6 out of 10, or 56%.
The true parameter is 55%. Samples wobble, but they center near the truth. That is why random samples can be trusted.
A single sample can land high or low. More samples, or a bigger sample, pull the estimate in. Week 8 measures that wobble.
- Read the question.
- Tap your answer.
| Statement | True or false? |
|---|---|
| Different random samples of the same population give different statistics. | ? |
| The parameter changes every time a new sample is drawn. | ? |
| 112 ÷ 20 = 5.6 | ? |
| Monday's sample of 6 was within the range of the twenty lab samples. | ? |
Good lab work. Tomorrow the ways a sample goes wrong, and the right way to draw one, step by step.