Tuesday
Tuesday: One Number for the Spread
Rocket holds up two score sheets. "Both of these have a mean of 6. So they are the same, right?"
Raven reads them. "One sheet says 6, 6, 6, 6, 6. The other says 2, 4, 6, 8, 10. What do you notice?"
"Same middle," Rocket admits. "But the second one is all over the place."
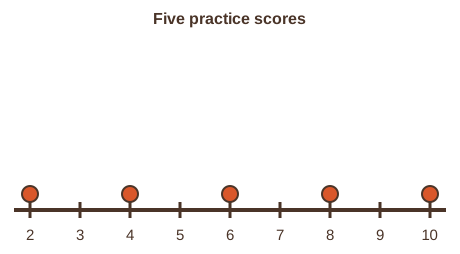
Nova projects both sets as dots. "A center is one number. The scatter needs its own number."
"The range is easy," Rocket says. "10 minus 2 is 8. The first set has a range of 0."
"Range only uses two values," Nova says. "Can you measure how far every dot sits from the mean?"
Rocket measures. "4, 2, 0, 2, 4 away. Average those, and you get 2.4."
"The mean absolute deviation," Raven says. "One number for the whole scatter."
Why we need a spread
Two data sets can share a center and still look nothing alike. One can be tight. The other can be scattered.
A measure of spread, also called a measure of variation, says how far the values scatter with a single number.
A small spread means the values huddle near the center. A large spread means they wander far from it.
You will learn three: the range, the mean absolute deviation (MAD) and the interquartile range (IQR).
Range and MAD
The range is the greatest value minus the least. For 2, 4, 6, 8, 10: 10 - 2 = 8.
The range is quick, but it only looks at the two end values. Everything in between is ignored.
The mean absolute deviation looks at every value. It is the average distance of the values from the mean.
- Find the mean. Here 30 ÷ 5 = 6.
- Find each value's distance from the mean. Distances are never negative.
- Add the distances.
- Divide by the number of values. That is the MAD.
| Value | Distance from the mean (6) |
|---|---|
| 2 | 4 |
| 4 | 2 |
| 6 | 0 |
| 8 | 2 |
| 10 | 4 |
The distances add to 12. Divide by 5: the MAD is 2.4.
On average, each score sits 2.4 points from the mean of 6. For the set 6, 6, 6, 6, 6 the MAD is 0. Nothing scatters.
Quartiles and the IQR
The interquartile range measures the width of the middle half of the data. It pairs with the median.
Order the data and find the median. The first quartile (Q1) is the median of the lower half. The third quartile (Q3) is the median of the upper half.
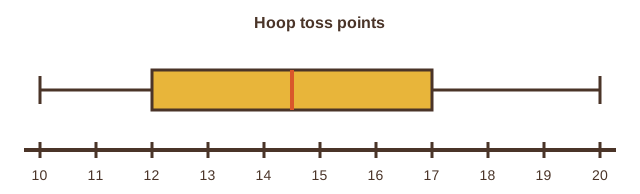
The IQR is Q3 minus Q1. It is the length of the box on a box plot.
Here are eight hoop toss scores: 10, 12, 12, 14, 15, 16, 18, 20. The median is 14.5, the mean of 14 and 15.
Lower half: 10, 12, 12, 14, so Q1 = 12. Upper half: 15, 16, 18, 20, so Q3 = 17.
IQR = 17 - 12 = 5. The middle half of the scores spans 5 points.
- Read the question.
- Tap your answer.
What is the range of 2, 4, 6, 8, 10?What is the mean absolute deviation of 2, 4, 6, 8, 10?What is the interquartile range of the hoop toss scores 10, 12, 12, 14, 15, 16, 18, 20?- Read the question.
- Tap your answer.
On the hoop toss box plot, where is the first quartile, Q1?Where is the median on the hoop toss box plot?- ?Add all the distances.
- ?Find each value's distance from the mean.
- ?Divide by the number of values.
- ?Find the mean of the data.
Find the MAD of each. Which set has the bigger MAD? Does it look more scattered?
Range, MAD and IQR: three ways to measure scatter. Tomorrow you toss paper balls and measure your own.