Data Day
Data Day: Ask Five People
Rocket races into the kitchen waving a tally sheet. "I asked everyone at breakfast. Family survey, done."
Raven reads it. "How many minutes did you read yesterday? Nice. What do you notice?"
"Five answers, mostly different," Rocket says. "A statistical question, for sure."
Nova hovers over the sheet. "Can you see the shape yet?"
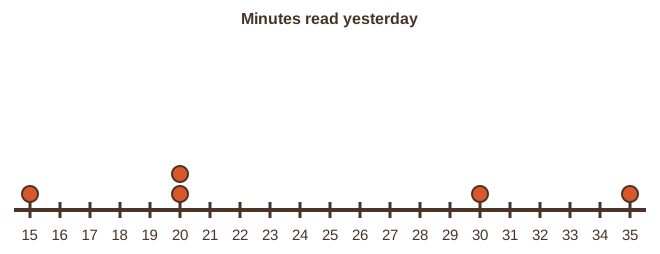
Rocket grabs graph paper and stacks five dots. "Two people said 20. One said 35. That one sticks out."
"Far out values are part of the story," Raven says. "Do not erase it."
Rocket adds a title. "Reading minutes in our home. First real dot plot of the weekend."
Nova dims. "Now hand the question to your crew at home."
- A statistical question expects different answers, so you collect data.
- A dot plot stacks one dot per value on a number line.
- A histogram shows how many values fall in each equal-width bin.
- A box plot shows the least, the greatest and the median.
- Describe a shape with peaks, clusters and gaps.
Rocket's family survey
Rocket asked five people at breakfast how many minutes they read yesterday. The answers were 20, 20, 30, 15, 35.
In order: 15, 20, 20, 30, 35. The peak is at 20. The far out value is 35.
Five answers make a small data set. The shape is rough, but it is a real shape, and it came from a real question.
Ask five family members or friends your family knows. Write down each number, not who said it.
Draw a dot plot of the five answers on graph paper. Add a title.
Together, find the peak, any gap and any far out value. Say the shape in one sentence.
If you ask neighbors, please go to the door with your student. Only people your family already knows take part.
Any family member who prefers not to answer simply skips it. Five answers from anyone willing is plenty.
- Read the question.
- Tap your answer.
How many dots are on Rocket's family plot?How far does Rocket's plot reach, from least to greatest?| Statement | True or false? |
|---|---|
| A survey for this course records what people answered, not who they are. | ? |
| A far out value should be erased so the plot looks neater. | ? |
| Five answers can still make a dot plot. | ? |
Great work this week. Next week you give that shape a center and a spread.