Thursday
Thursday: The Seedling Tray
Raven lays the seedling log beside a tray of eight pots on the Numbers Desk. "Week four for the whole tray."
"Seedling A went from 8 cm last week to 10 cm," Rocket reads. "That is 2 cm. Seedling C went from 20 to 25. That is 5."
"So C grew more," he says. "Way more."
"What do you notice if you compare each change with where it started?" Raven asks.
Rocket thinks. "2 out of 8 is a quarter. 5 out of 20 is also a quarter. They both grew 25 percent!"
Nova hovers over the tray, her light moving from the driest pot to the wettest. "Now look at the water," she says.
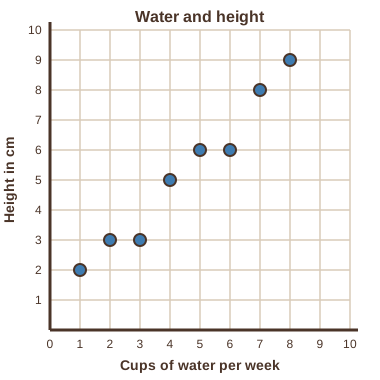
Raven plots one dot per pot: cups of water per week across, height up. "What do you notice about the dots?"
"More water, taller plant," Rocket says. "Mostly. The dots rise together."
Percent increase and decrease
A percent change compares the change with the starting amount, not the ending amount.
Seedling A: from 8 cm to 10 cm. The change is 2. Then 2 ÷ 8 = 0.25 = 25%. A 25% increase.
Seedling C: from 20 to 25. The change is 5. Then 5 ÷ 20 = 0.25 = 25%. The same percent increase.
A decrease works the same way. From 10 sign-ups to 8 is a change of 2, and 2 ÷ 10 = 20%. A 20% decrease.
The crew's sign-up counts
The crew compared last year's Field Day sign-ups with this year's. These are the crew's own tallies, not real records.
| Game | Last year | This year | Change | Percent change |
|---|---|---|---|---|
| Ring toss | 8 | 10 | +2 | 25% increase |
| Relay | 20 | 25 | +5 | 25% increase |
| Paper ball toss | 12 | 15 | +3 | 25% increase |
| Seedling table | 10 | 8 | -2 | ? |
- Read the question.
- Tap your answer.
A scatter plot of two measurements
A scatter plot puts one dot for each pot: cups of water per week across, height at week 4 up.
When the dots rise together from left to right, the two measurements have a positive association. More of one goes with more of the other.
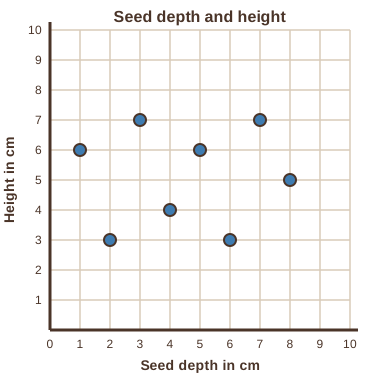
When the dots are scattered with no slope, there is no clear association.
A dot far from the rest is an outlier. The crew's tray has none, but watch for them.
- Read the question.
- Tap your answer.
| Statement | True or false? |
|---|---|
| Percent change divides the change by the starting amount. | ? |
| 2 ÷ 8 = 0.25 | ? |
| From 20 to 25 and from 8 to 10 are the same percent increase. | ? |
| Dots that rise from left to right show a negative association. | ? |
| 5 ÷ 25 = 0.25 | ? |
Excellent data work. Tomorrow you find proportional relationships all over everyday life, and review the week.